
Both Have 20 Grams of Protein. What Does a Protein Quality Score Compare?
DIAAS is a comparison of digestible amino acids with a reference pattern. Here's what goes into the score and what it can tell you about a plate of food.
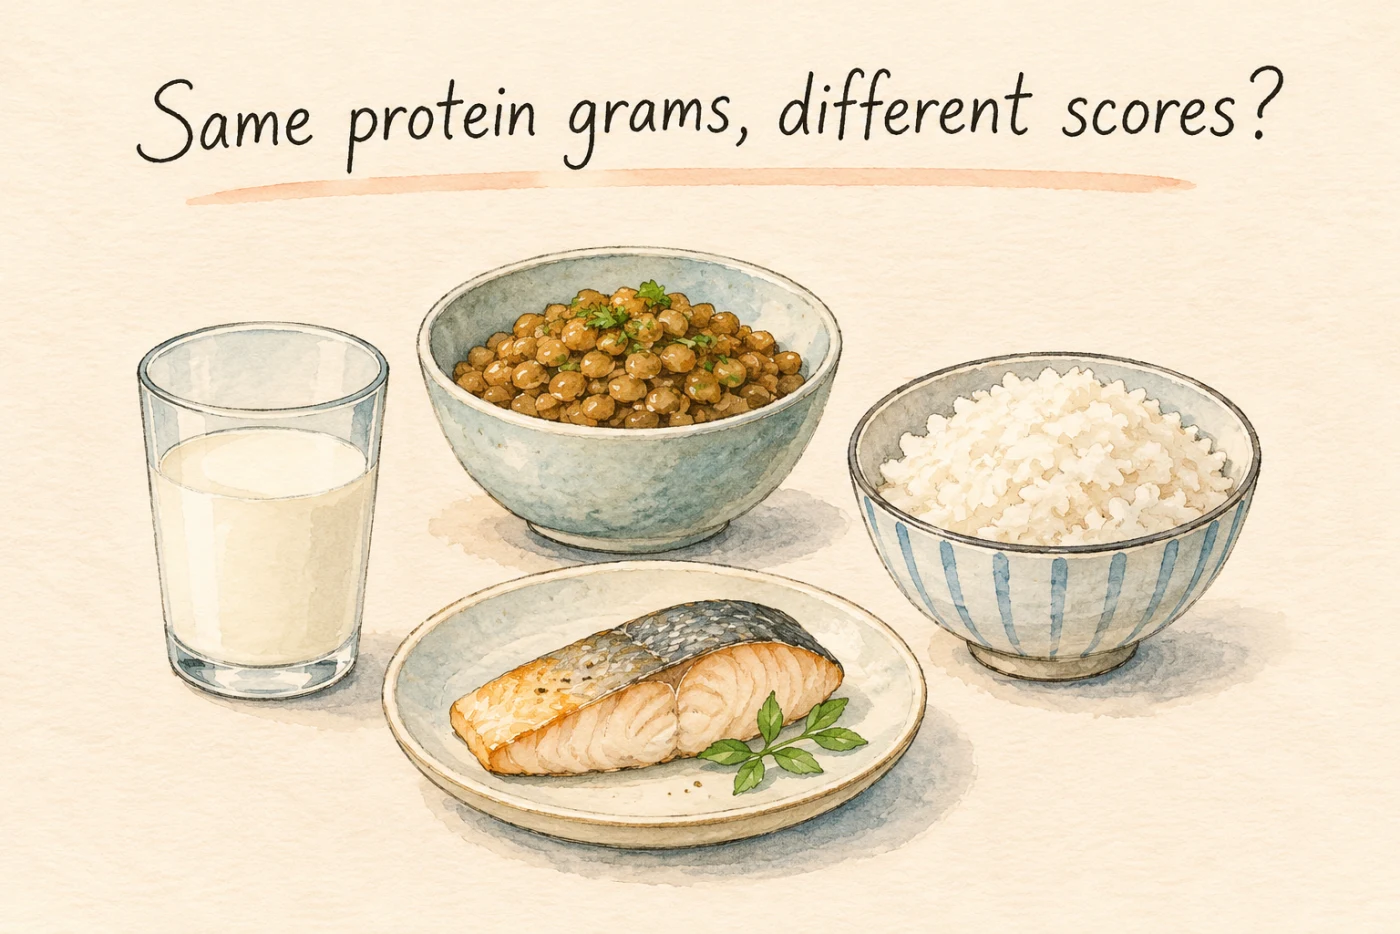
You can work out the portion of milk, beans, or fish that contains 20 grams of protein. That's an amount. Then you might come across a protein quality score and see a number that's higher for one food than another. Does a lower number mean you absorb less of the 20 grams?
The digestible indispensable amino acid score, or DIAAS, compares how much of each digestible essential amino acid a gram of protein provides against a reference pattern. The lowest ratio becomes the score. An 80 doesn't say that you absorbed only 80 percent of the protein. The number refers to the amino acid that falls furthest below or sits least far above its reference amount [1].
Count the pieces one at a time
Proteins are made of amino acids. Digestion breaks proteins apart so the body can use those amino acids. The body can't make enough of certain ones on its own, so it needs to get these essential amino acids from food. Two sources can have the same total amount of protein and different proportions of those pieces. One source might be lower in lysine relative to the reference, while a different amino acid might be the lowest for another food.
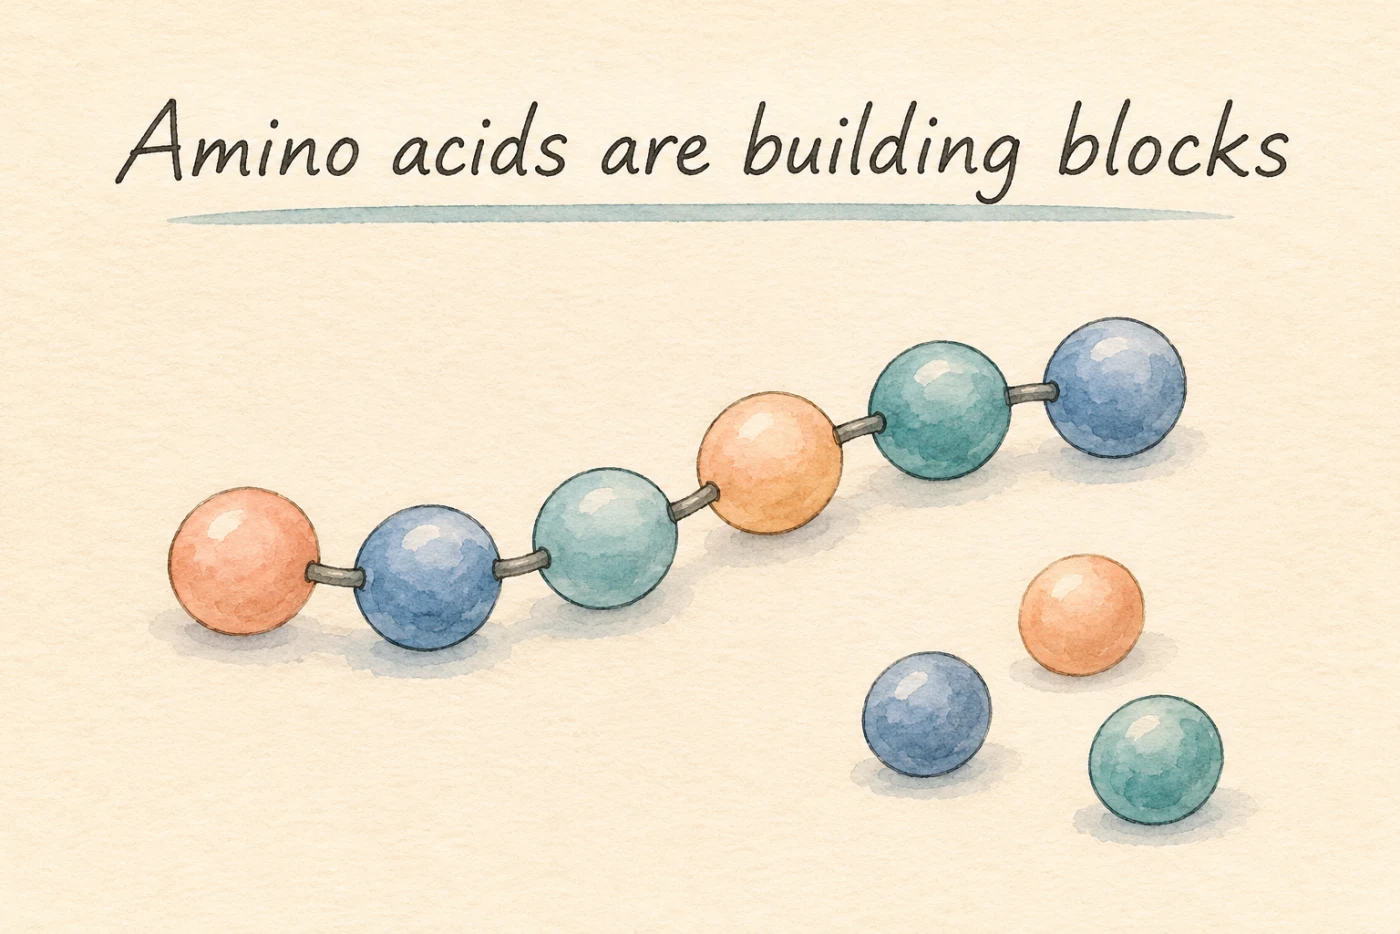
Start with one gram of the protein you want to assess. Find out how much of each essential amino acid it contains. Then account for the digestibility of each one and compare those amounts with the corresponding reference. The first limiting amino acid is the one with the lowest ratio. Multiplying that ratio by 100 gives the score [1].
Here's some sample arithmetic. Say a gram of a protein contained 40 milligrams of digestible lysine, and the reference amount in this example was 50 milligrams per gram. Divide 40 by 50 and you get 0.8. If all the other essential amino acids met a greater fraction of their reference amounts, this protein would score 80. A few of the other amino acids might be at or above their reference amounts. Multiplying the 20 grams on a nutrition label by 0.8 would treat every amino acid as if it were the one that set the score.
Why do some measurements stop at the end of the small intestine?
One earlier scoring method uses nitrogen measured in feces to estimate overall protein digestibility. Bacteria farther down the digestive tract can change what ends up in that sample. The small intestine is where most amino acid uptake happens, so DIAAS tries to estimate what remains at its end. It also uses an individual digestibility value for each essential amino acid instead of applying the same estimate to all of them [1].
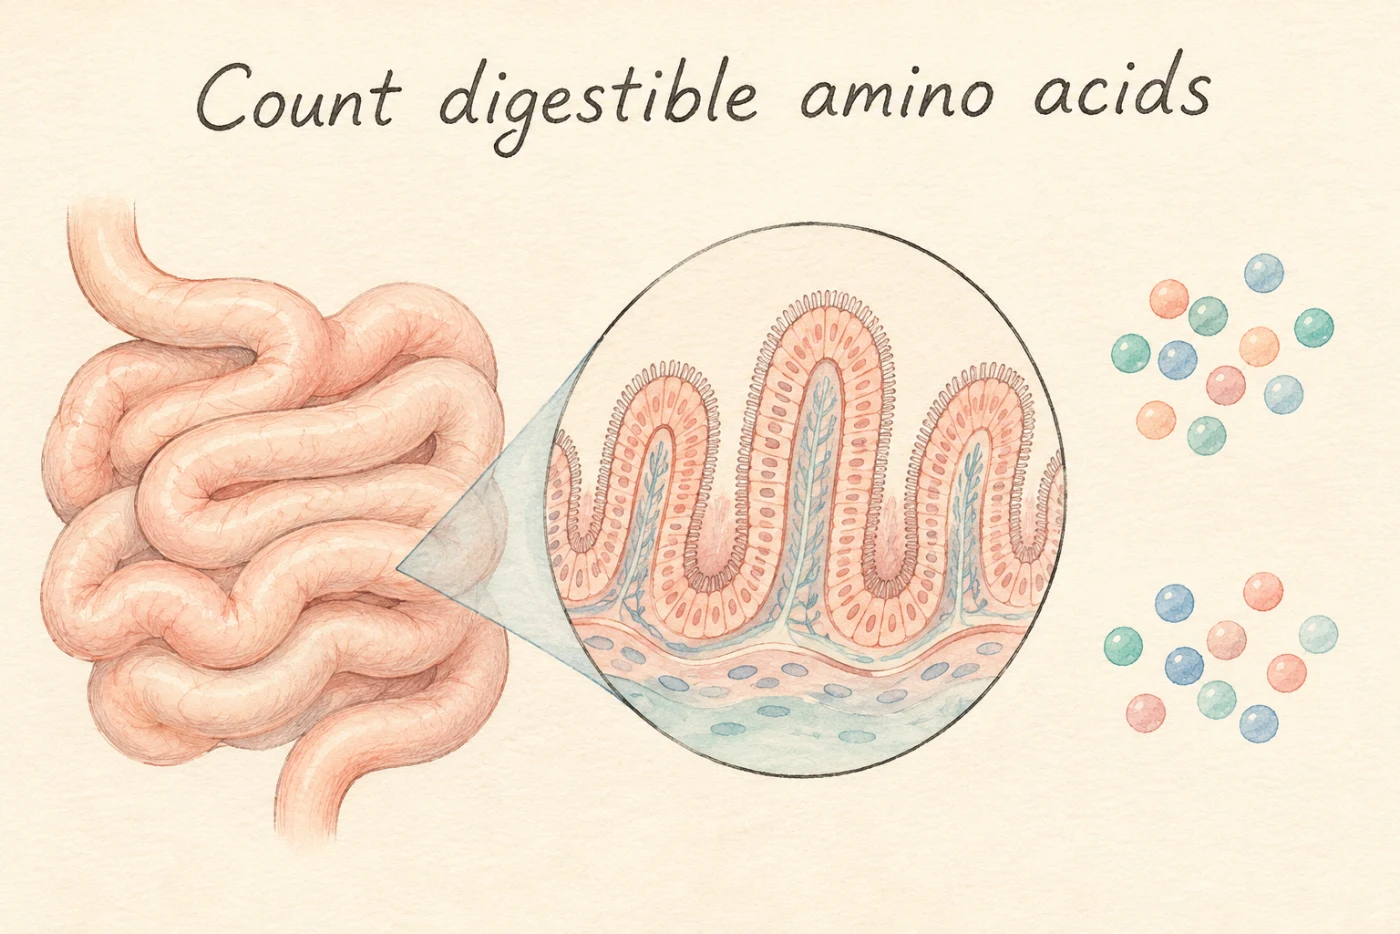
In 2015, a study compared methods for 14 sources of protein using growing male rats. The nitrogen digestibility estimates from the small intestine and from feces differed for 11 of the 14. That's an animal experiment asking whether measurement methods give the same answer. It gives a reason to pay attention to how a score was measured, rather than assigning the study's score for a concentrate or isolate to a dish in your kitchen [2].
The FAO's reference pattern changes with the age group. The food, the method, and the reference set are all part of what the number compares [1].
Some scoring systems also put a ceiling on how high the number can go. You might see two different labels applied to scores that are both in the 80s. Before putting them side by side, check whether they used the same method, the same sort of food sample, and the same reference. A difference in reading can come from the way the number was produced as well as from the food itself.
What about beans and rice on the same plate?

If one source is lower in lysine and another provides more, a person eating both can get lysine from both. To calculate a combined score, you'd need to know the amount of each food, what amino acids each one contains, and their digestibility. Averaging two scores leaves out which amino acid set each score, as well as how much of each food was actually eaten [1].
For an example, use two hypothetical proteins. Give the reference pattern 50 milligrams of lysine and 25 milligrams of sulfur amino acids per gram. Suppose food A has 40 and 33 digestible milligrams, while B has 70 and 15. Assume the other essential amino acids all meet the reference. The lysine makes A's score 80. The sulfur amino acids make B's 60.
Now get 10 grams of protein from each. Per gram of the combined protein, you get 55 milligrams of digestible lysine and 24 of sulfur amino acids. Those are 110% and 96% of the illustrative reference. The lower of the two is 96%, quite different from the average of the individual scores, which is 70%. These aren't scores for particular foods. The arithmetic shows why the combined comparison uses the digestible amino acids they contribute, instead of averaging numbers based on different limiting amino acids [1].
Think about why you want the number. If you're wondering how many grams of protein you get from dinner, start with the serving you eat. If you're wondering where your protein is coming from overall, look back at what you had across the day. You might have rice at lunch, beans at dinner, and milk earlier in the morning. A score for one ingredient can't calculate how all three contribute together.
Back at those portions of milk, beans, and fish, the 20 grams still tell you how much protein there is. The score answers a different comparison. Which essential amino acid supplies the lowest share of its reference amount once digestibility is taken into account?
References
- FAO. (2013). Dietary protein quality evaluation in human nutrition.
- Rutherfurd SM, et al. (2015). Comparison of protein quality scores in growing male rats. Journal of Nutrition.