
Is the lean tissue on a DXA report the same as muscle?
A whole-body DXA scan estimates bone mineral, fat, and lean soft tissue. Here is how the three estimates are made and how scientists use the limb figures to predict skeletal muscle mass.
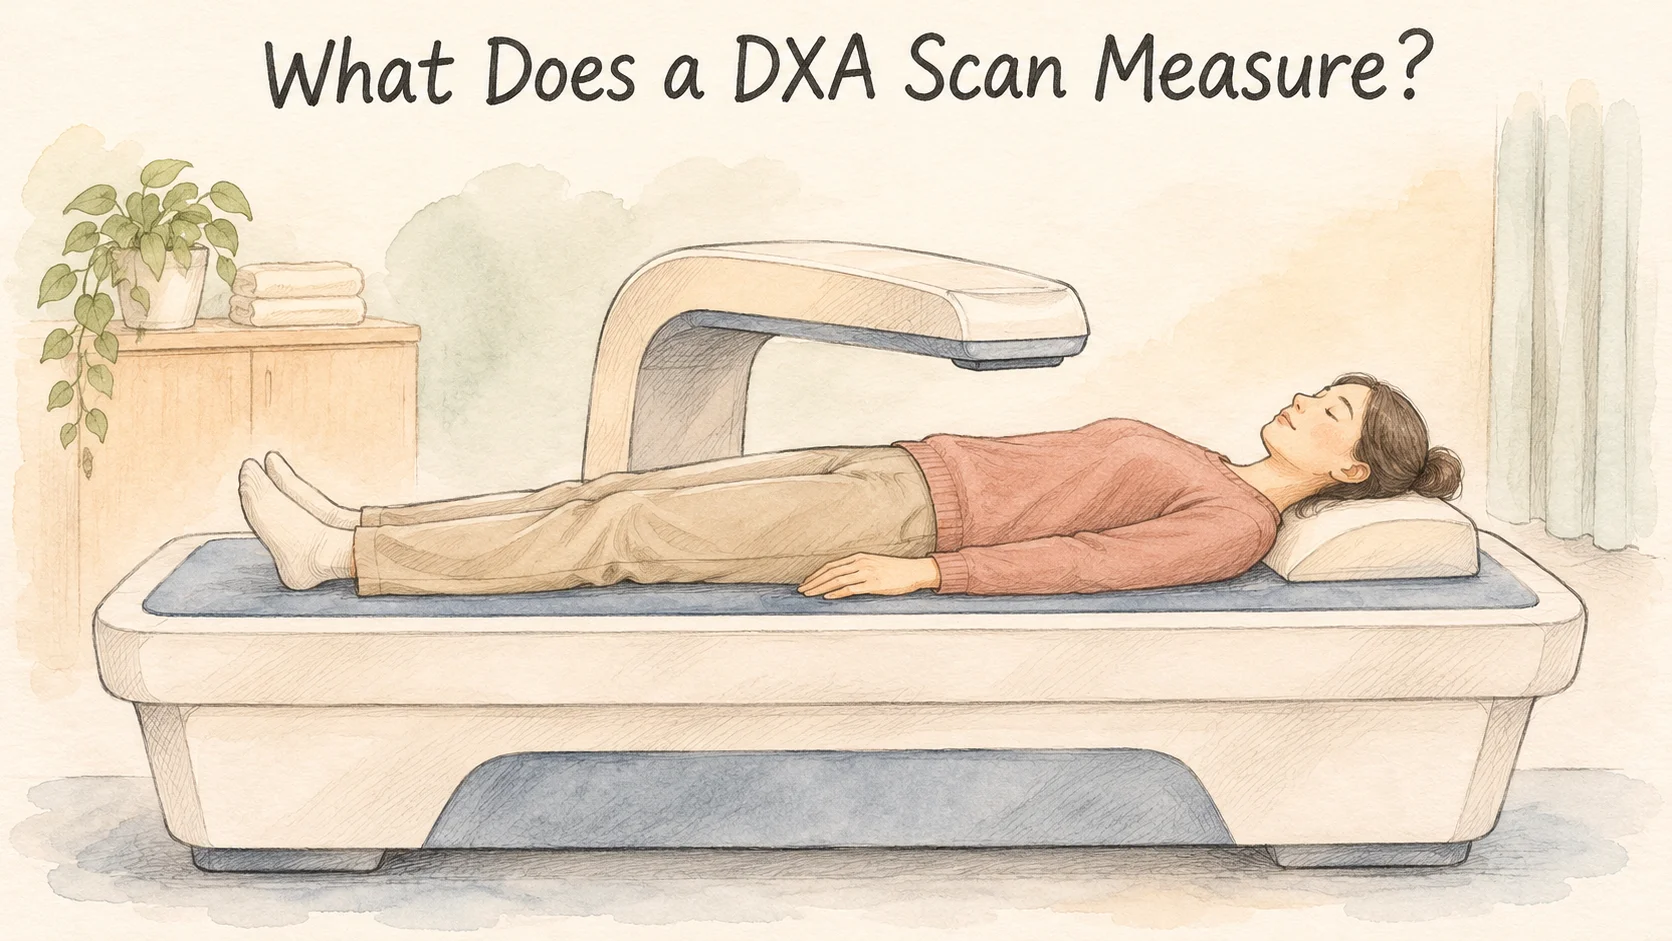
Two months after a whole-body DXA scan, you get a second report. Lean soft tissue has gone up by half a kilogram. Can you say you gained half a kilo of muscle? The lean soft tissue on a DXA report includes muscle along with water, skin, and other soft tissue. Muscle may have changed as well. A difference between the two lean soft tissue figures cannot tell you by itself how much muscle you gained [1, 2].
DXA stands for dual-energy X-ray absorptiometry and is also written DEXA. It gives you totals for different parts of the body and different kinds of material. The report is easiest to read after you see how the scanner puts material into three columns and how a research team uses one of those columns to estimate a different quantity.
How do two X-ray energies produce three estimates?
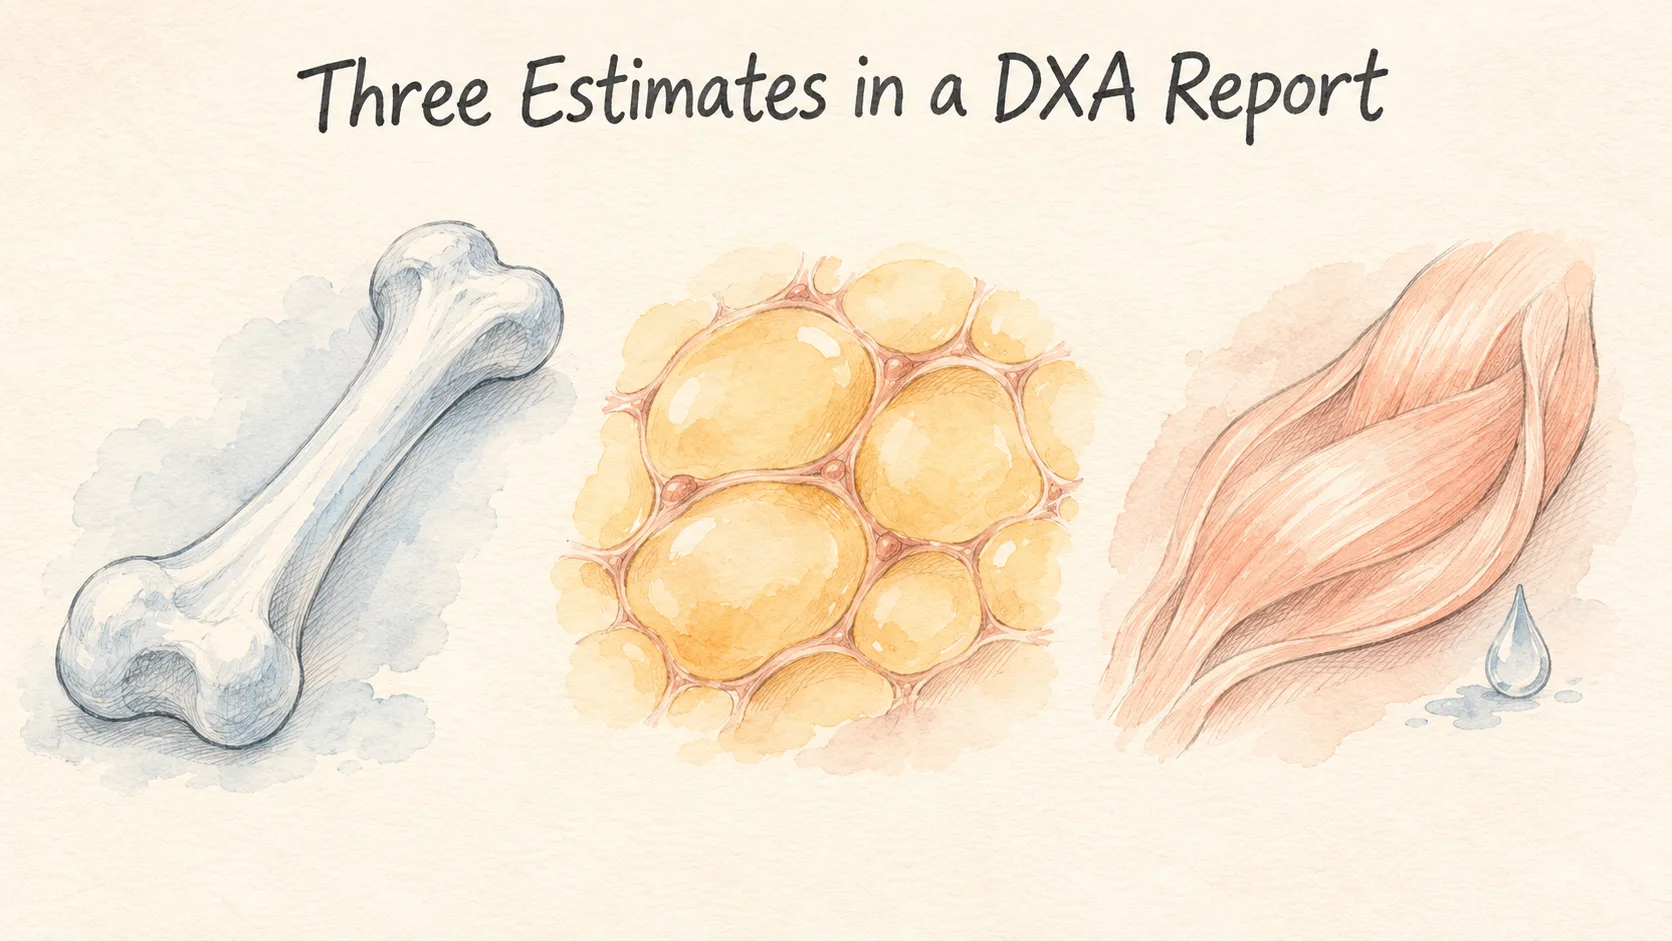
The scanner arm moves over the table and collects signals at two X-ray energies. As X-rays pass through the body, different materials weaken them by different amounts. The machine compares the weakening at the two energies and uses a model to estimate what the rays passed through. In a part of the image without bone, it estimates how much of the soft tissue is fat and how much is lean. Where bone lies in the path, the estimate accounts for both mineral and the soft tissue over the bone, using information from the surrounding areas [1].
Add up the regions, and a whole-body DXA report can show bone mineral content, fat mass, and lean soft tissue mass. It can also report those estimates for a region such as the arms or the trunk. Bone mineral content and bone mineral density may both appear on a report. Content has a mass unit such as grams. In DXA, the density usually means grams of mineral per square centimeter of the projected area of bone [1].
Take a fictional report as an example. It estimates 2.5 kilograms of bone mineral, 18 kilograms of fat, and 49.5 kilograms of lean soft tissue. The estimates add to 70 kilograms, and 18 divided by 70 gives a fat percentage of about 26%. Those figures fit together arithmetically. The label “lean soft tissue” still belongs with the 49.5. Relabeling that entry as muscle would claim an estimate the scan has not supplied.
Another label to check is fat-free mass. When it means all mass other than fat, it includes bone mineral as well as lean soft tissue in this model. These are adjacent ideas, and reports can name their columns differently. Check what the field includes before comparing a value labeled fat-free with another one labeled lean soft tissue [1].
Why use the limbs to estimate muscle?
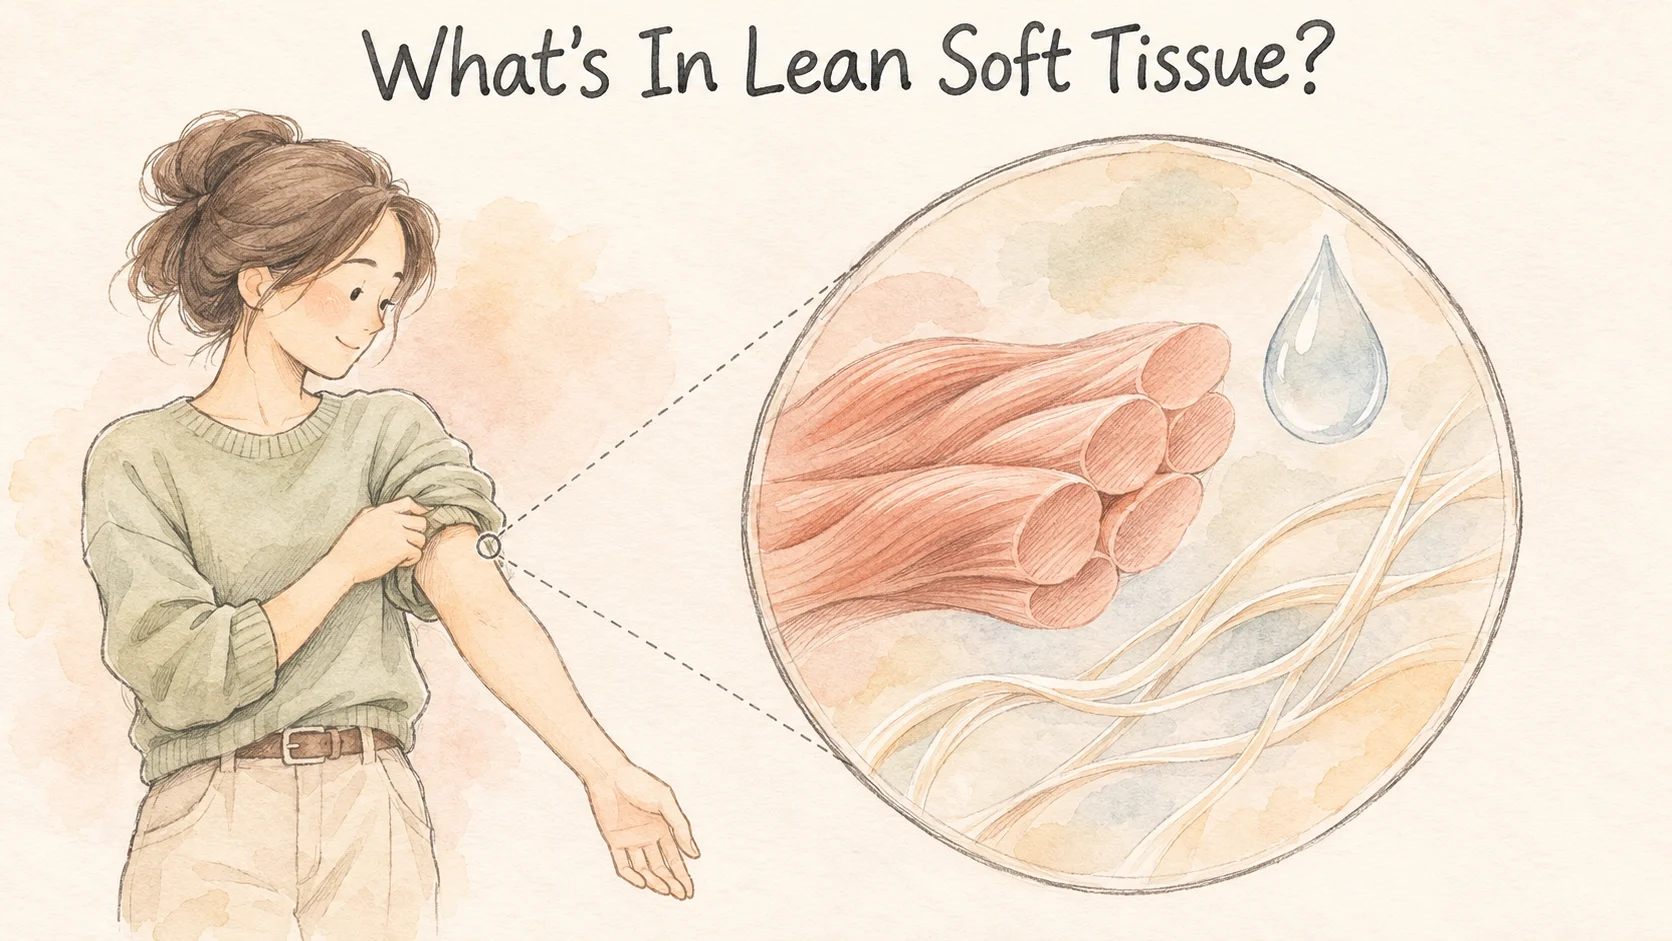
Some reports call the lean soft tissue in the arms and legs ALM, or appendicular lean mass. A large share of the body's skeletal muscle is in those four limbs, which makes the figure a useful clue. Other lean tissue in the limbs also contributes to it. The trunk's muscles, meanwhile, sit outside the regions added up for ALM. To use the limb estimate to predict muscle in the whole body, researchers need to compare it with a reference measurement [2].
One team collected both whole-body DXA and magnetic resonance imaging, or MRI, in 475 adults. It used DXA to estimate lean soft tissue in the limbs and MRI images to estimate skeletal muscle. The team developed a model on the paired data from 380 people and checked it in another 95. Each participant in the second group had separate figures: one predicted from the DXA limb numbers and one estimated from the MRI images [2].
In that 95-person validation group, the root mean square error for estimating whole-body skeletal muscle was 1.74 kilograms. The measure combines the differences between predicted and reference values across people and gives larger differences more weight. It tells you how the model performed for that group. It does not assign an error range to every reader or establish how much of a half-kilo change between two of one person's DXA reports came from skeletal muscle [2].
If you see “whole-body lean soft tissue,” “appendicular lean mass,” and “estimated skeletal muscle” in one place, circle the region in each phrase. One figure covers the whole body, another adds the limbs, and a prediction may use a formula to arrive at a muscle estimate. The columns can all be reported in kilograms. Keeping the names lets you tell which regions and which estimate are in play.
The validation group was set aside so that the model could be tried on people whose measurements had not been used to build it. That analysis reported an R-squared of 0.93, a strong relationship between the predictions and the MRI-based results across the group. A strong relationship still leaves room for differences in the paired numbers. The report gives both the strength of the relationship and a summary of the size of the differences [2].
Why might repeat scans give different estimates?
A second study had 31 physically active young adults complete five whole-body DXA scans over two days. They scanned in the morning before breakfast, then again about five minutes later after repositioning on the table. They were scanned after their usual daily activities, before breakfast the following morning, and about half an hour after that meal. The sequence allowed comparisons of what happened after a person lay down again and after a longer period with different conditions [3].
When people only changed their position on the table, the estimated whole-body values generally varied little. Regional estimates could vary more. After usual daily activities or breakfast, the results generally showed an increase in both the mean lean mass estimate and the variation in those estimates. The researchers were studying measurement conditions on a short timescale. They were not following the creation of new skeletal muscle from breakfast through the next half hour [3].
Consider a pair of reports where the whole-body figures have barely changed but one leg has moved more. The repeat-scan study gives a reason to check the regions and conditions before giving that small change a physical explanation. A regional estimate and a whole-body estimate are different views from a scan, and agreement over the whole body does not supply a precision figure for one particular leg.
Compare the same line on both reports

Put the date, region, field name, and unit on the same line in your notes. Some reports are in grams and others show kilograms. Find the same field on the other report, and keep any details it includes about the scanner or conditions. If the whole-body lean soft tissue entry increased by half a kilogram, the comparison you can write down is “whole-body lean soft tissue: up 0.5 kg.” You will still have the original measurement when another report gives you something to compare it with.
References
[1] International Atomic Energy Agency. Dual Energy X Ray Absorptiometry for Bone Mineral Density and Body Composition Assessment. IAEA Human Health Series No. 15. 2011.
[2] McCarthy C, et al. Total and regional appendicular skeletal muscle mass prediction from dual-energy X-ray absorptiometry body composition models. Sci Rep. 2023;13:2590.
[3] Nana A, et al. Effects of daily activities on dual-energy X-ray absorptiometry measurements of body composition in active people. Med Sci Sports Exerc. 2012;44(1):180–189.