
How a Weight-Loss Plateau Forms
A flat stretch can reflect normal variation or a smaller average gap between energy intake and expenditure. See how these change over time.
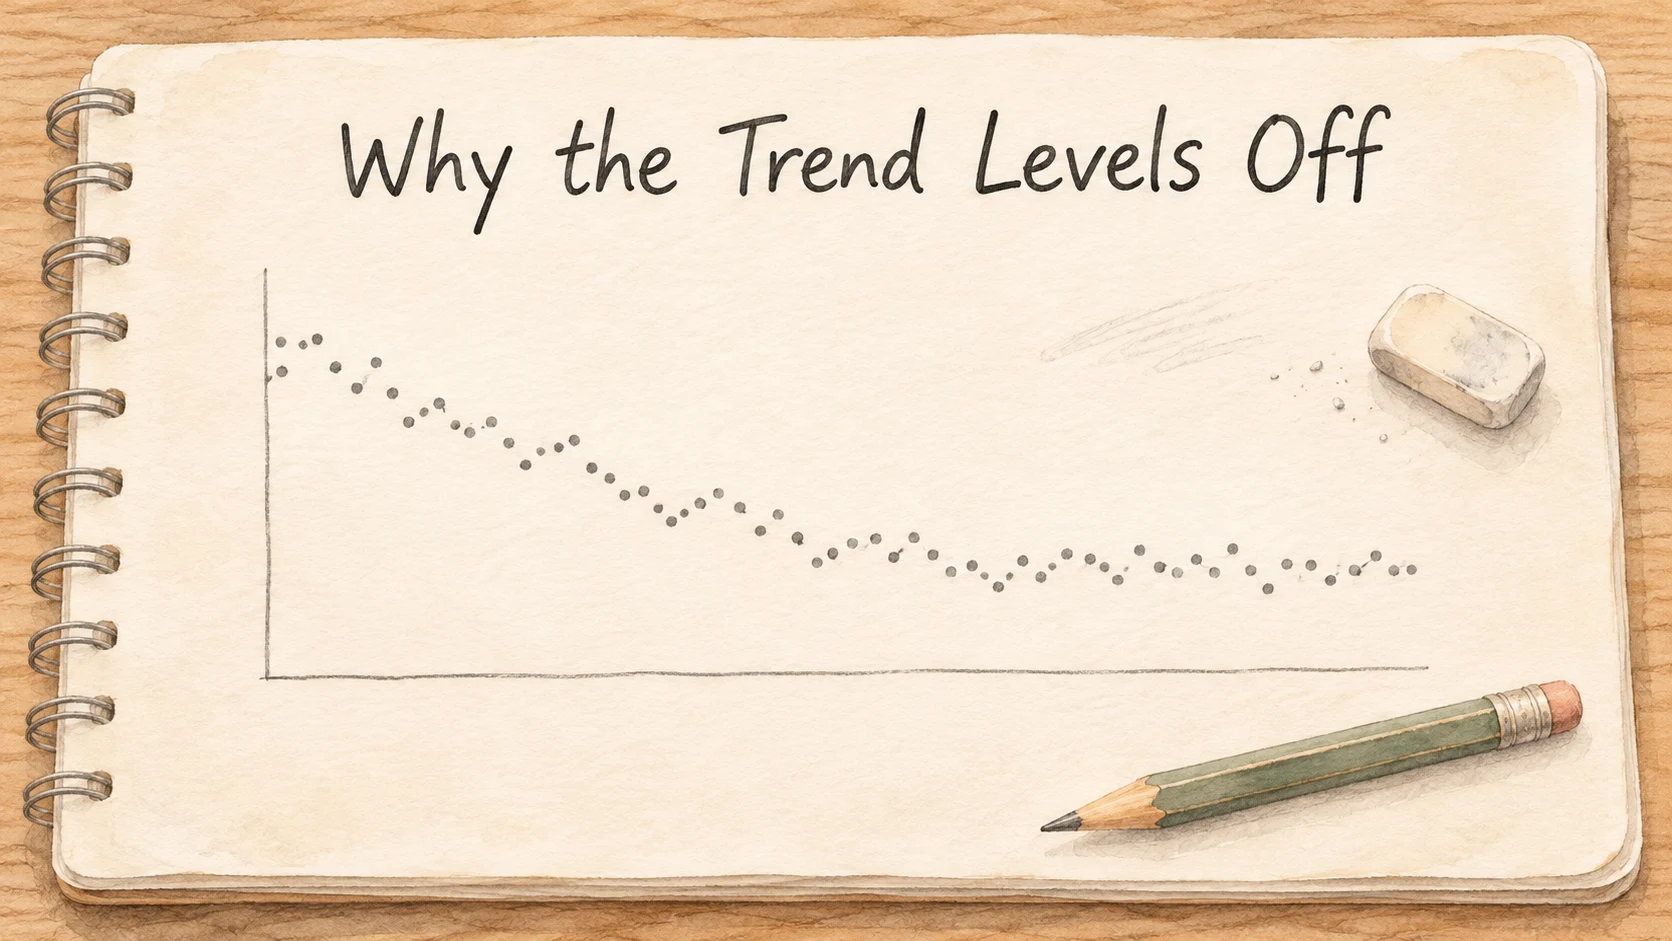
Your weight was coming down, and your last few readings have all landed around the same place. Start by comparing the ups and downs of a few days with the direction of several weeks. If the average has really flattened under similar measuring conditions, one possibility is that the gap between average energy intake and expenditure has narrowed. Body size, how much you eat, and how you move can all change that gap.
A few similar weigh-ins leave several possibilities open. The scale weighs you along with the water and food your body is carrying at that moment. Keep the readings and build up a few comparable stretches. Recent measurements are easier to interpret alongside an earlier stretch with a similar routine. Then it's easier to see whether the downward direction has slowed, or whether you happened to weigh yourself on higher days.
A gap can shrink while you're doing familiar things
Imagine someone with an average daily energy expenditure of 2,200 calories who starts eating an average of 2,000. At that point the gap is 200 calories a day. Over time they weigh less, so the same walk moves less body mass, and their expenditure over a whole day may change. If it becomes 2,050 calories while average intake stays at 2,000, the gap in this example shrinks to 50.
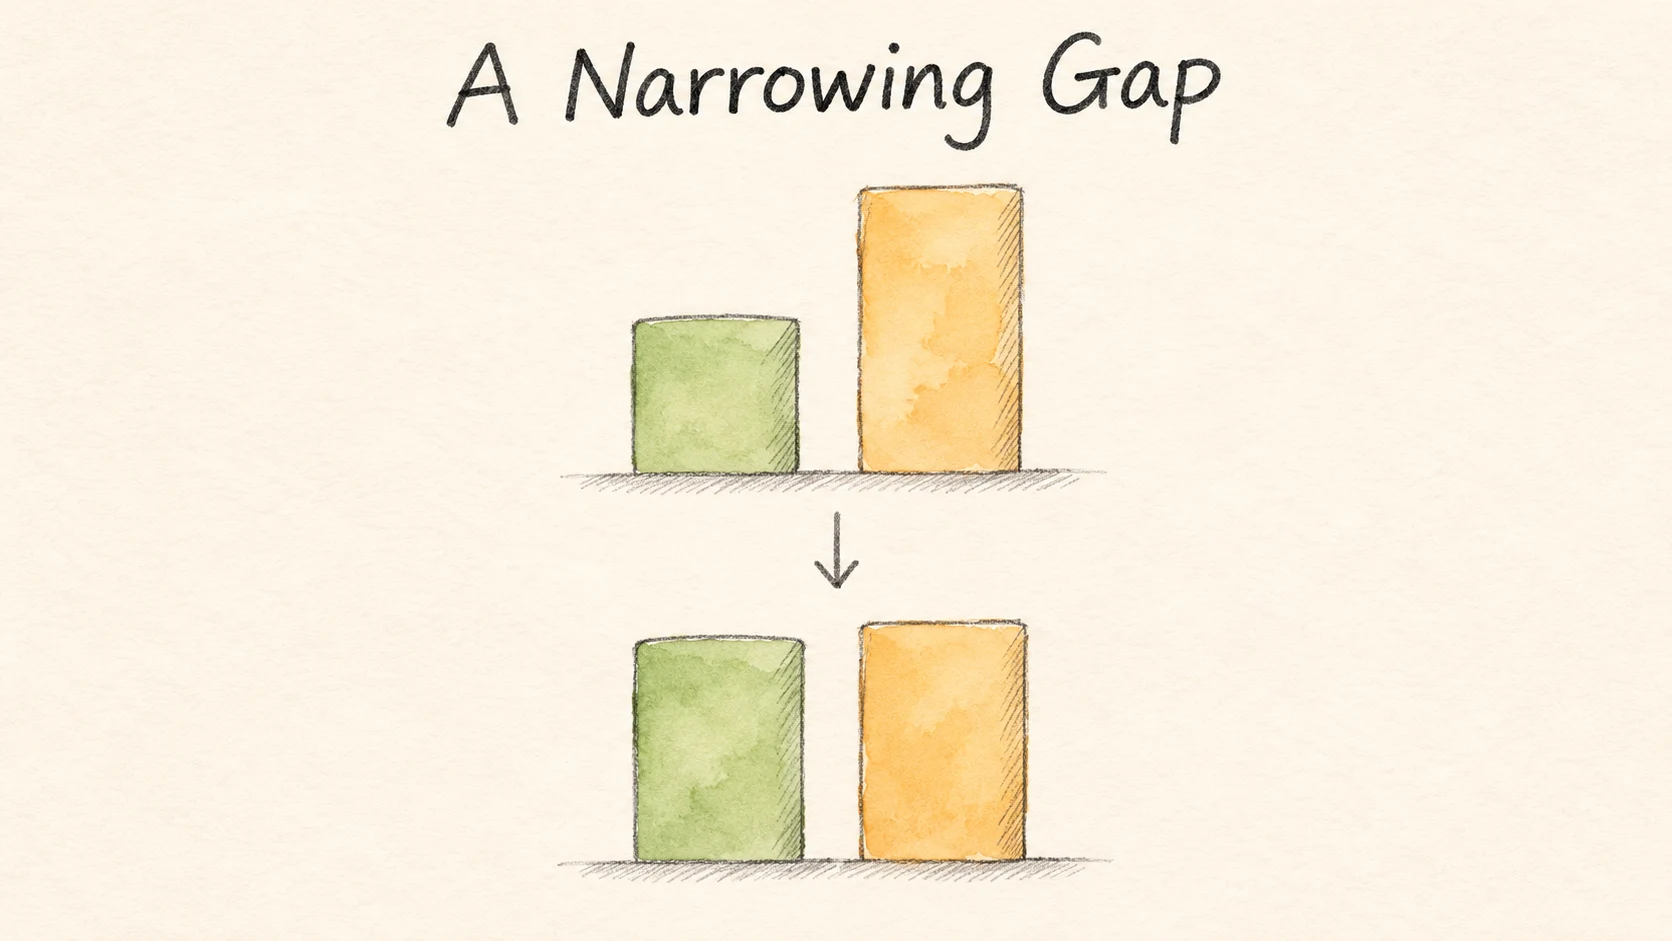
These numbers are for arithmetic. They show how the difference between two values can move as your body changes. As average intake and expenditure get closer, the change in stored energy gets smaller, and weight usually changes more slowly. Over a shorter stretch, shifts in water can make the numbers on the scale move ahead of that direction or lag behind it. [1]
Kevin Hall's team at the US National Institutes of Health modeled how body weight and energy use change over time. The model lets body mass, body composition, and expenditure change after a change in intake. In their estimate for adults, reaching about half of the eventual weight change after a sustained adjustment in intake takes roughly a year. It's the scale of time in their model, with individual results depending on the starting point and the change. [1]
The Hall energy balance model shows why weight can change more slowly over time even with a sustained change in energy intake. The body you are supporting and moving is changing too.
Try picturing the same commute before and after a change in body weight. It's still the same number of blocks, so your route feels familiar. Your total daily expenditure also reflects what you do for the rest of the day. A different job schedule might take out two little walks, or add a long stretch of standing. A calculation from the start of a plan can lose relevance when the day it was based on changes.
If both eventual averages were near 2,000 calories, the example would reach a point where stored energy was changing very little. The earlier slope would not have to repeat even if the person kept eating about the same. If there were still a small gap, a few unchanged readings could sit within a slower downward stretch. Comparable measurements over time help tell those situations apart.
Why everyday curves can look different from the model
How much you eat can move gradually too. A portion can drift, or a late work shift may change the times you eat and what you pick up on the way home. Exercise and other activity can change with the weather, your schedule, or time at work. Small changes can be hard to place on a particular day, so compare your current routine with the one you had several weeks earlier.
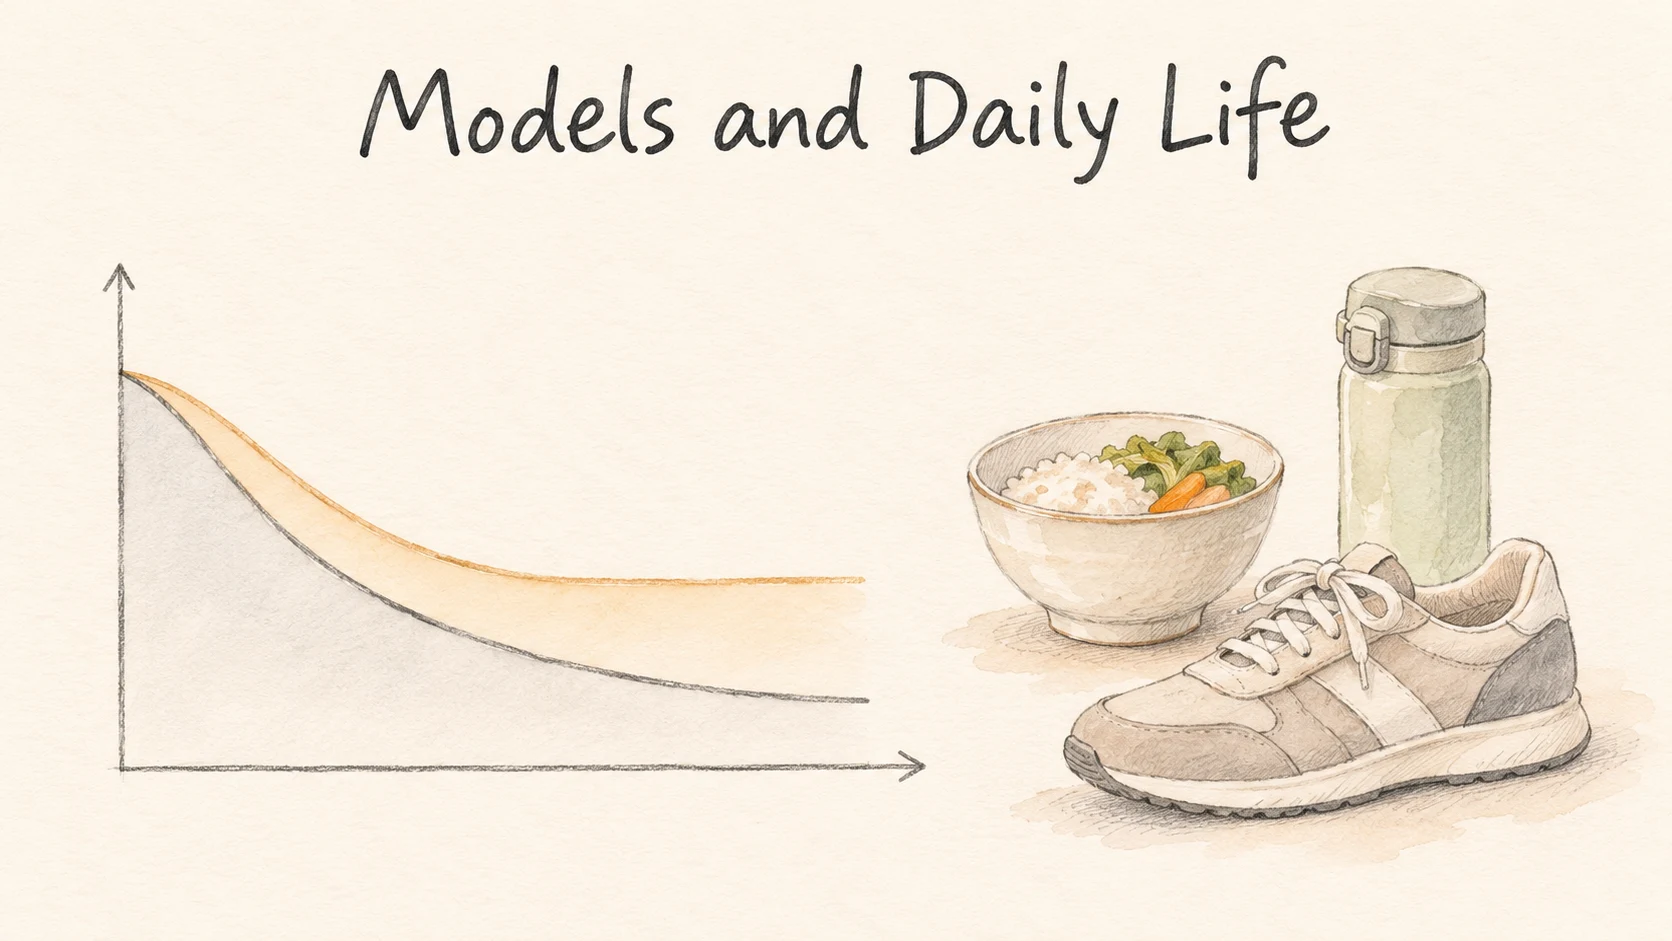
Appetite can change as well. In a separate study, Polidori and colleagues used data from a trial of a type 2 diabetes drug that causes some glucose to leave the body in urine. The team used weight changes and an energy model to infer whether people made up that energy by eating more. Their modeled group response corresponded to roughly 100 extra calories per day in the drive to eat for every kilogram of weight lost. This was an estimate from weight records and a model. The team did not directly measure every meal, and the number describes the people and setting they studied. [2]
Several of these influences can happen together. A lighter body uses less energy to move on a walk. A busier schedule may affect your usual activity, and being hungrier may change what you order. The scale shows what all those changes add up to. Working back from a flat line to the exact contribution of each one would require information beyond that line.
What to look at when the line seems flat
Put a few weeks of records next to one another. Did you use the same scale at the same time of day? Are there missing days that leave one week with mostly weekend readings and another with weekdays? If you have little comparable data so far, let the record grow. If similar weeks are consistently flat, look back at what was happening when the average was moving.

Imagine you started working at home and stopped walking to catch the bus. Your lunch may still look the same, and your day contains a little less walking. Or you may be hungrier in the afternoons and ordering an extra snack. Pick one change you can check. Look at the calendar to see which days you went out, or write down that snack with the rest of the meal so you can see how often it happens.
A calendar can help you compare like with like. If one week contained travel or long shifts, compare it with another week that had a similar schedule. Then look at weeks when you followed your ordinary day. You can compare the whole pattern before deciding which part of it deserves more attention.
What's worth changing depends on why you're following the trend. If you set out to maintain your weight, a fairly level record can fit that goal. If you were hoping for a continued change, look first at the parts of the routine you can keep comfortably and where you need help. There is no decision required by any one weigh-in.
Next time you step on the scale, put the reading back into its time span. If that stretch really has leveled out, look for one recent change in the way you measured or in how your days are going. That gives you something concrete to check before deciding what comes next.
References
[1] Hall KD, et al. Quantification of the effect of energy imbalance on bodyweight. Lancet. 2011;378:826–837.
[2] Polidori D, et al. How strongly does appetite counter weight loss? Quantification of the feedback control of human energy intake. Obesity. 2016;24:2289–2295.