
What Do You Learn by Dividing Your Waist Measurement by Your Height?
Two people with the same waist can have different ratios. A Taiwanese study shows what the measure can add to screening, and what gets missed at a cutoff.
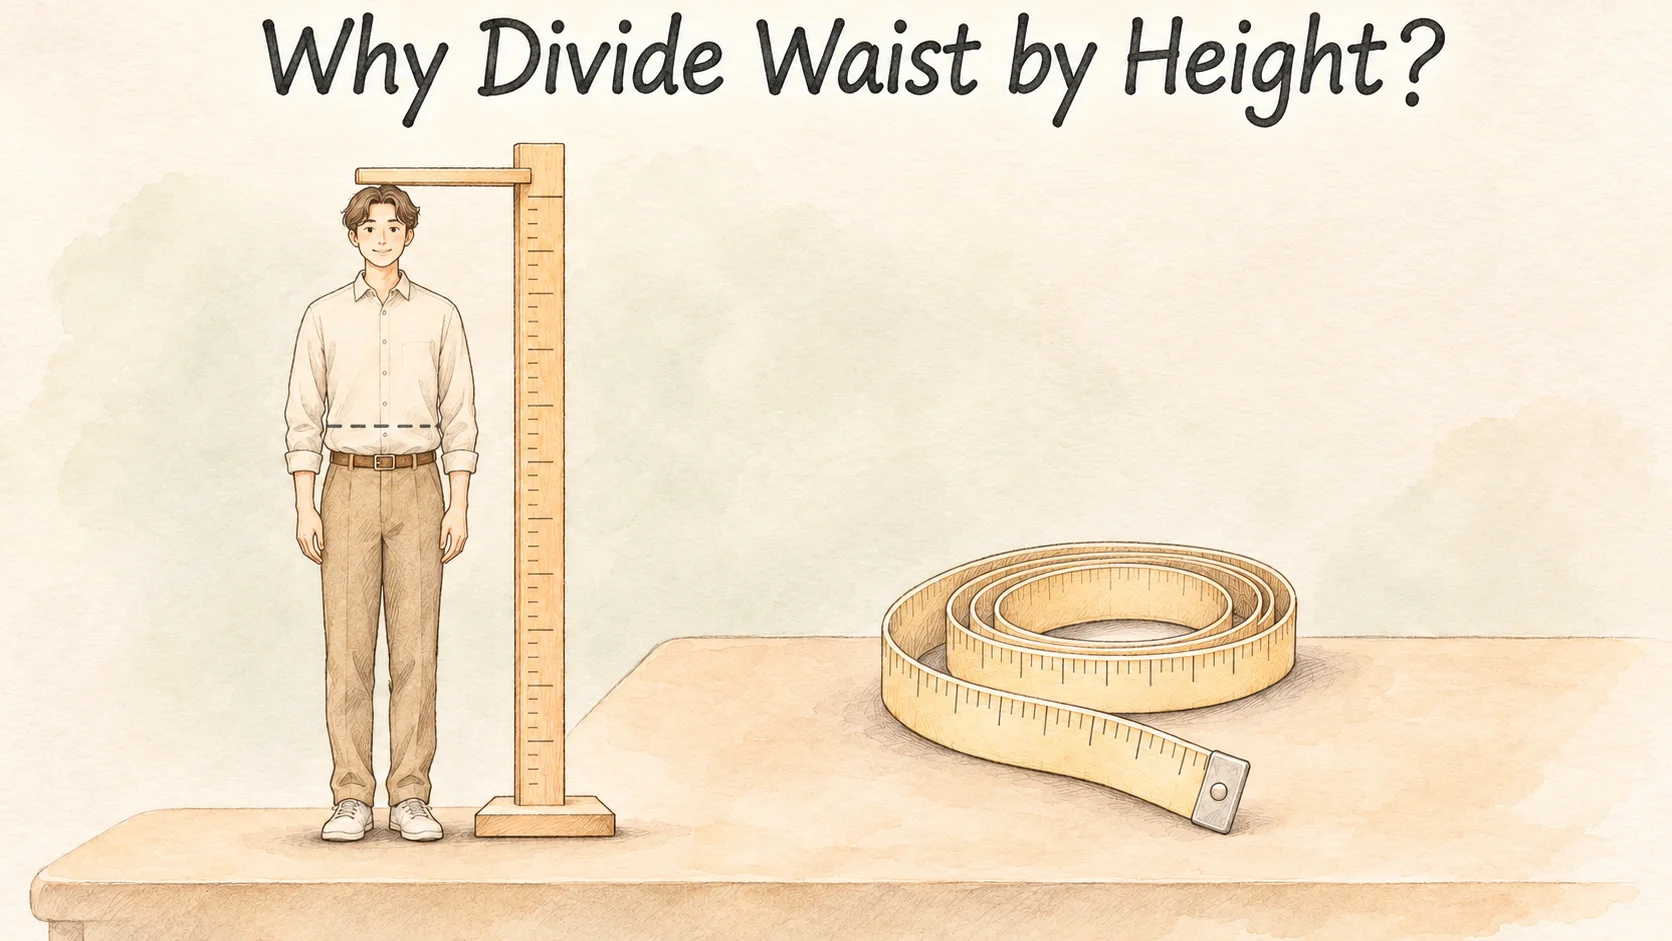
You and a friend both measure 80 centimeters around the waist. You're 160 centimeters tall. Your friend is 180 centimeters tall. Divide each waist measurement by the person's height and the ratios come to 0.50 and 0.44. The ratio adds one piece of information to the tape reading. It tells you how large that circumference is relative to the person's height.
A Taiwanese study used measurements from 36,642 adults and found that the ratio could help distinguish people with certain findings at the same health check. The study arrived at different cutoffs for different findings. A ratio near one-half can be a useful scale for comparison. A cutoff still leaves people on both sides who don't match what the line suggests [1].
The same waist measurement with two different denominators
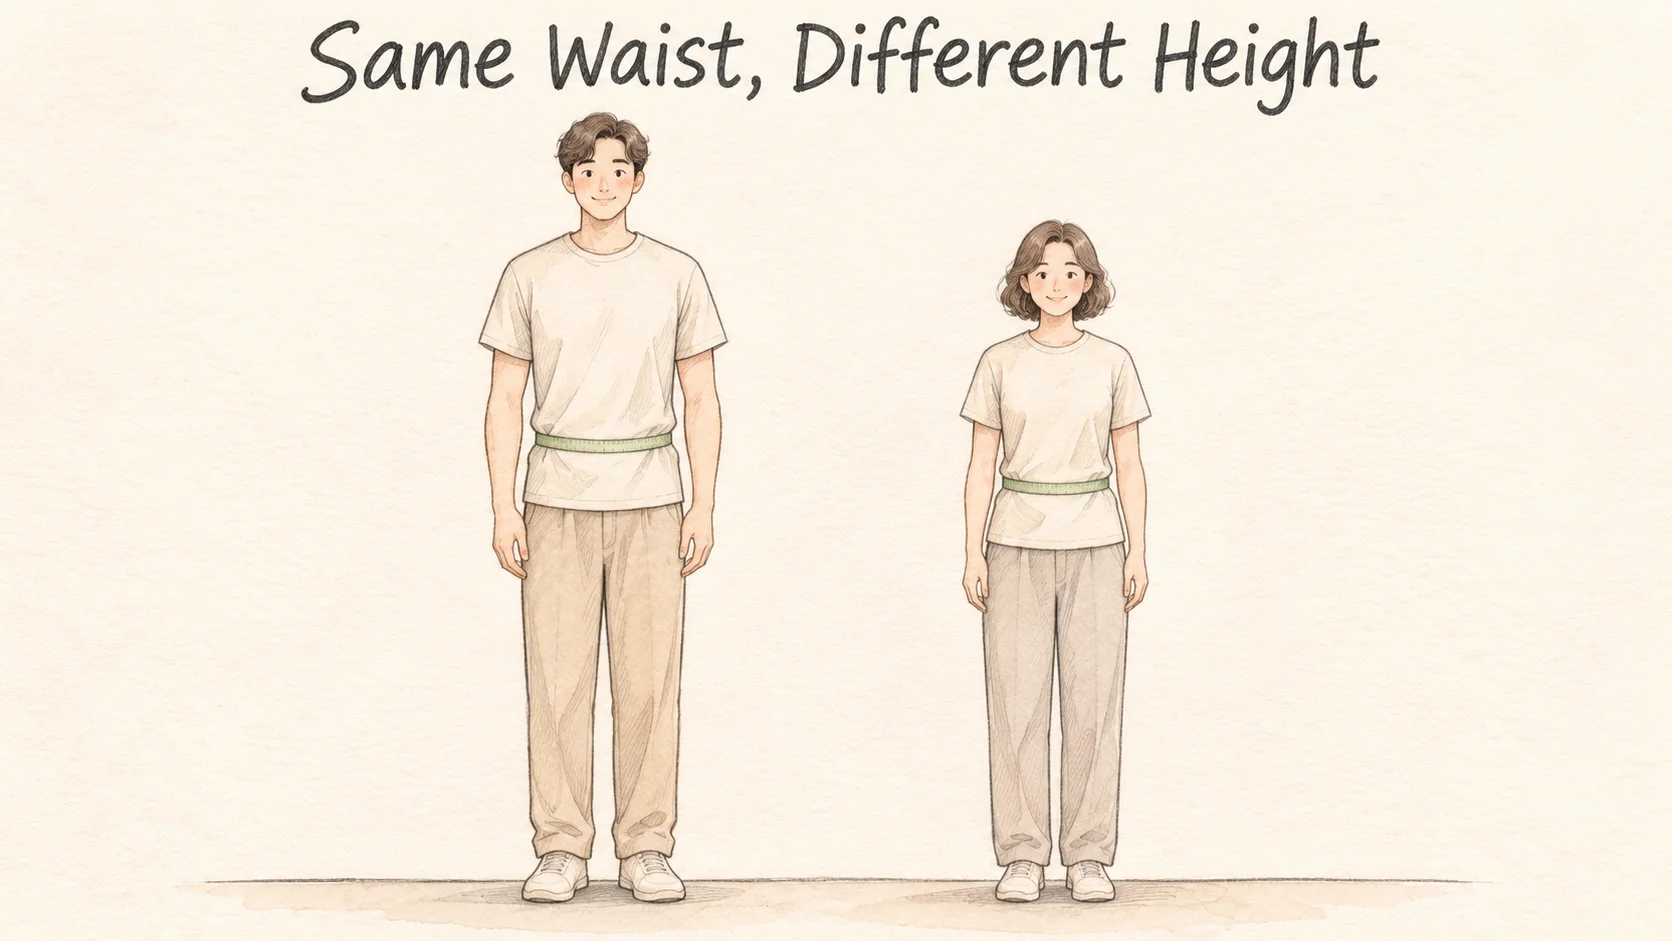
The calculation is waist circumference divided by height. Use the same units for both. Eighty divided by 160 comes to 0.50. Eighty divided by 180 comes to about 0.44. The centimeters cancel out, leaving a ratio that you can write as a decimal or as 50% and about 44% of height.
You can also start with a ratio and work backward. A ratio of 0.50 corresponds to a waist of 80 centimeters for someone who's 160 centimeters tall and a waist of 90 centimeters for someone who's 180 centimeters tall. The circumferences differ by 10 centimeters at the same ratio. The calculation puts each outside dimension in relation to height. It gives no separate measurements of the fat just under the skin or around organs.
Converting both measurements to meters gives the same ratio: 0.80 divided by 1.60 is still 0.50. If you divide 80 centimeters by 1.60 meters without a conversion, the result is 50, a hundred times larger. Matching the units matters much more for this calculation than adding extra decimal places.
BMI also uses height, but it puts weight in the numerator and divides by height in meters squared. Waist-to-height ratio compares two lengths. Keeping the original measurements beside both results helps you remember what each is summarizing. You can have two people with the same waist and different ratios, or two people at the same ratio and different waists.
How did the researchers arrive at cutoffs near 0.50?
The Taiwanese study drew on health checkups at four Chang Gung hospital branches in 2010. It included 21,038 men and 15,604 women. Researchers compared the body measurements with results from the same checkup, including glucose, blood pressure, and blood lipids. For each outcome, they moved the proposed cutoff for the ratio up and down to see how many people it flagged [1].
The study also defined where to place the tape. Staff measured midway between the lower border of the twelfth rib and the top of the hip bone, with the participants standing. A tape that goes around the navel or along a waistband can record a different circumference. The location is part of the method the researchers used [1].
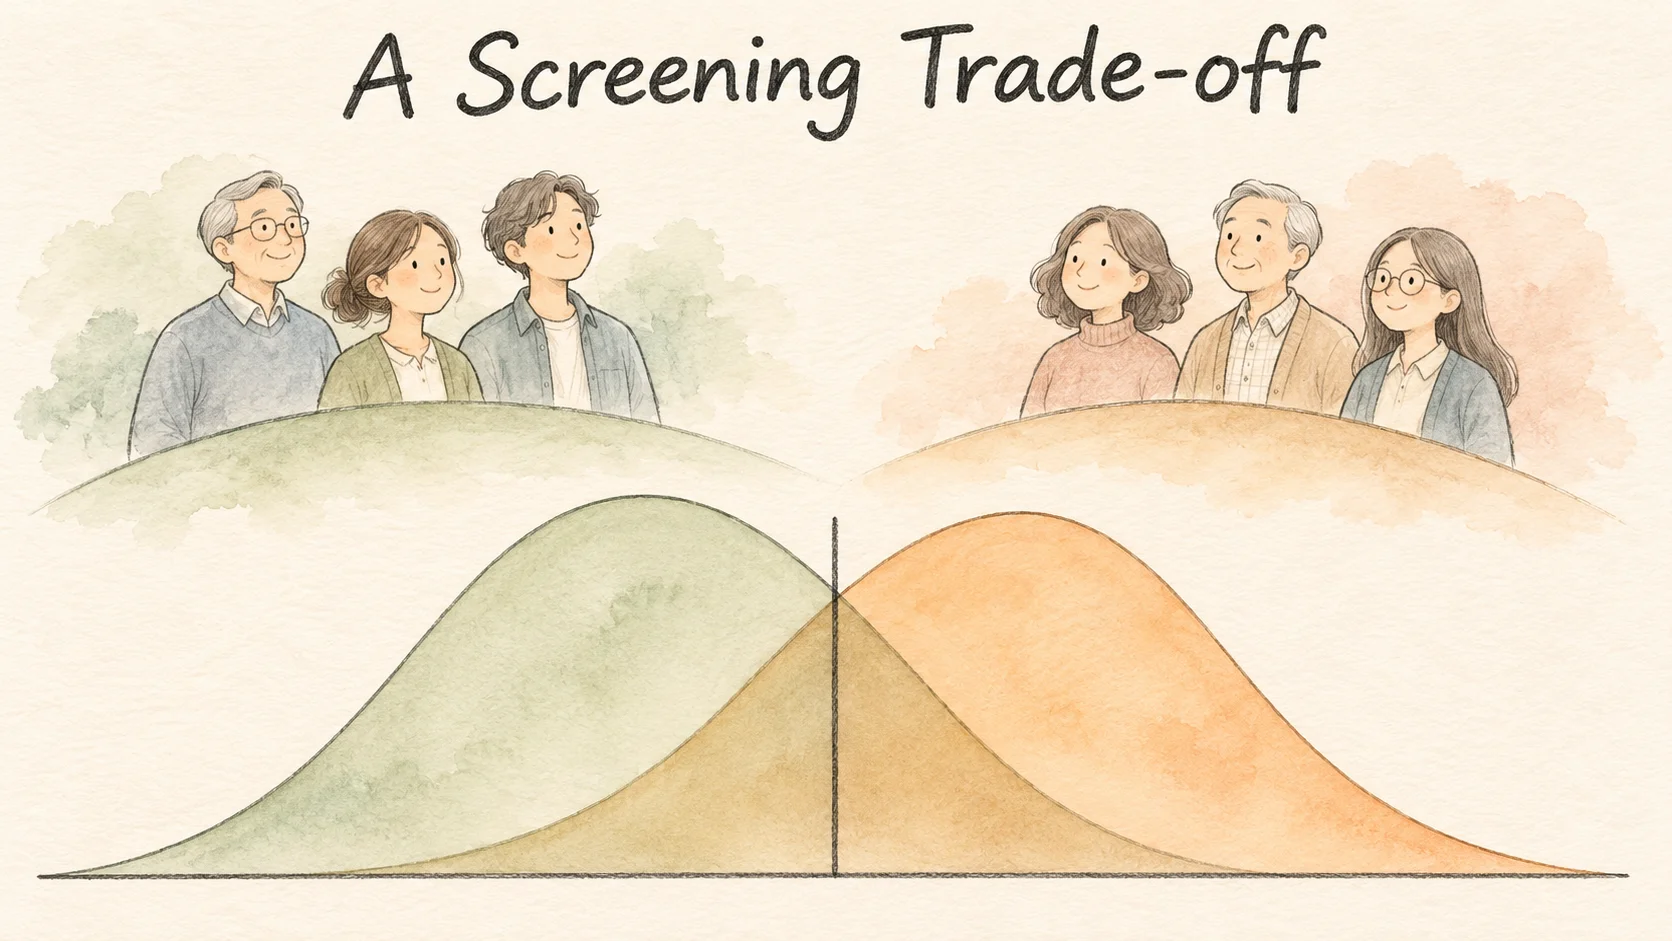
A lower cutoff usually flags more people. It can catch some of the people the study is trying to identify and can also flag some people who don't have that outcome. A higher cutoff reverses that trade-off. Sensitivity is the share of people who have the outcome and are flagged by the cutoff. Specificity is the share of people who don't have the outcome and stay below it. They're calculated with different denominators [1].
| Diabetes classification at the same checkup | Selected ratio | Sensitivity | Specificity |
|---|---|---|---|
| Men | 0.503 | 78.1% | 59.7% |
| Women | 0.497 | 80.3% | 76.3% |
Take the men's row as an arithmetic example. Start with 100 men who meet the study's diabetes classification. At 78.1% sensitivity, the cutoff would flag about 78 and miss about 22. Take another 100 men who don't meet that classification. The specificity suggests that about 60 would stay below the line. These are hypothetical groups to illustrate the percentages. The real checkup population didn't have 100 people of each kind for every calculation [1].
There is another question you might ask. Among people flagged by the cutoff, how many had the outcome at the checkup? That answer depends partly on how common the outcome was in the group being screened. You cannot get it by reading 78.1% in the sensitivity column. The denominator in that column is the number of people already classified as having diabetes.
Changing the outcome changed the cutoff. In the men's analysis, for example, the study selected 0.482 for high total cholesterol and 0.514 for metabolic syndrome. Both numbers are close to one-half, but each reflects a different outcome and a different trade-off. A cutoff chosen from one data set describes how these measures separated people in that particular group. Its performance needs another test in a different group [1].
Identifying a finding now and predicting it in five years
The Chang Gung analysis measured height, waist, and the checkup findings around the same time. Another Taiwanese study followed people in the township of Toucheng, Yilan, beginning in 2000. The average starting age was about 62. It enrolled 372 residents and followed up with 250 around five years later. The researchers asked how well the ratio predicted new cases of diabetes. In that group, it had limited predictive ability [2].
The question changed with the design. The first study could look at who already had an outcome at the time of the health check. The second had to wait to see who developed it later. The groups also differed in age and setting. When a headline says a measure “predicts” something, it helps to see whether the researchers actually waited for the outcome or used findings already present at the checkup.
Follow-up also brings its own measurement problem. Fewer people were followed in Yilan than enrolled at the start. The number with a later observation matters for any question about who developed a new condition. It helps to read both numbers instead of assuming every starting record was paired with a later one [2].
Keep the original measurements beside the ratio
If you write down a ratio, keep the waist measurement, height, date, and where you put the tape. At 160 centimeters tall, a reading of 79 centimeters gives a ratio close to 0.494. A reading of 81 centimeters gives about 0.506. Two centimeters in the original measurement are enough to put these two examples on opposite sides of 0.50. Knowing the date and measuring site can help explain how the values compare.
The two waists at the start were both 80 centimeters. The added height tells you how much that distance represents for each person. To understand a screening result from a study, keep the outcome and the population in view as well.
References
[1] Li WC, et al. Waist-to-height ratio, waist circumference, and body mass index as indices of cardiometabolic risk among 36,642 Taiwanese adults. Eur J Nutr. 2013;52(1):57–65.
[2] Kuo RJ, Wu YH, Chen LK. Inability of waist-to-height ratio to predict new onset diabetes mellitus among older adults in Taiwan: a five-year observational cohort study. Arch Gerontol Geriatr. 2011;53(1):e1–e4.