
What Happens to Resting Energy Expenditure After Weight Loss?
A resting test measures one part of daily energy use. Learn why researchers compare it with a prediction for the new body composition.
Your weight is lower than it was a few months ago, and your resting energy test comes back lower too. Has your metabolism changed? Resting energy expenditure can fall as body weight and body composition change. Another question researchers ask is how much the result differs from what they would expect at your new body composition. That second question requires a new prediction to compare with a new test.
Resting expenditure is one part of total energy use. It describes the energy you use under quiet resting conditions. Time spent on your feet, carrying things, and exercising falls outside the resting test. Both resting and daily energy expenditure can be expressed in calories. Check what each report actually measured before comparing the numbers.
How can breathing while you rest give a result in calories?
Even when you are lying quietly, your heart still pumps and your organs are working. Researchers can estimate energy expenditure with indirect calorimetry. They measure how much oxygen you use and how much carbon dioxide you produce during rest, then use those gases to estimate energy use over the measured interval. Some devices use a clear ventilated hood to sample the air around your head. The resting rate is usually expressed in calories per day so different tests are easier to compare. [1]
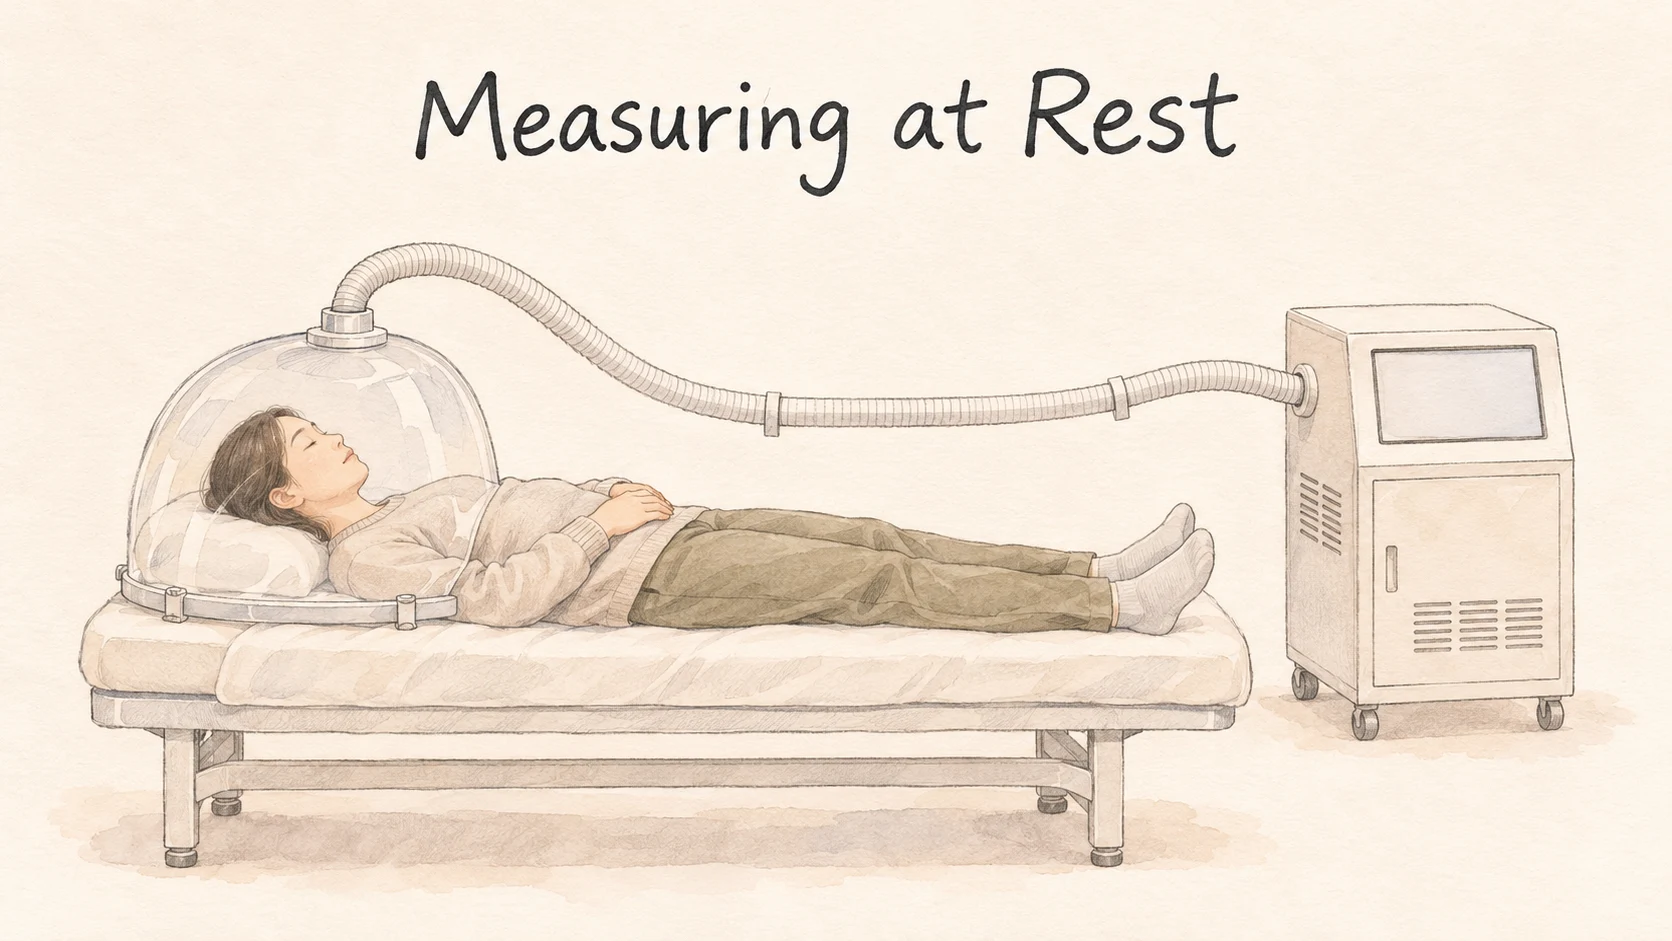
A report of 1,500 calories per day projects the rate measured during that session to 24 hours. It doesn't mean you spent a day in the lab or that this was your energy use on the day of the test. A regular day includes meals and movement, and both affect energy use. A watch's total or an estimate of exercise calories describes something different from that resting result.
A number can also come from an equation without a breathing test. An equation might use age, height, and body weight, or it might include fat mass and fat-free mass. Its inputs describe the people it is trying to estimate. When two reports both mention resting energy use, look for which one came from a gas measurement and which one came from the equation. That determines what kind of comparison you can make.
Predicted 1,450 and measured 1,400. What is the difference?
Suppose someone measured 1,600 calories at rest in their first test. Months later, using the amount of fat and fat-free mass they have now, a model predicts 1,450. A second test measures 1,400. The two tests differ by 200 calories. In this arithmetic example, 150 are accounted for by changes represented in the prediction. The remaining 50 are the gap between measured and predicted resting energy use.
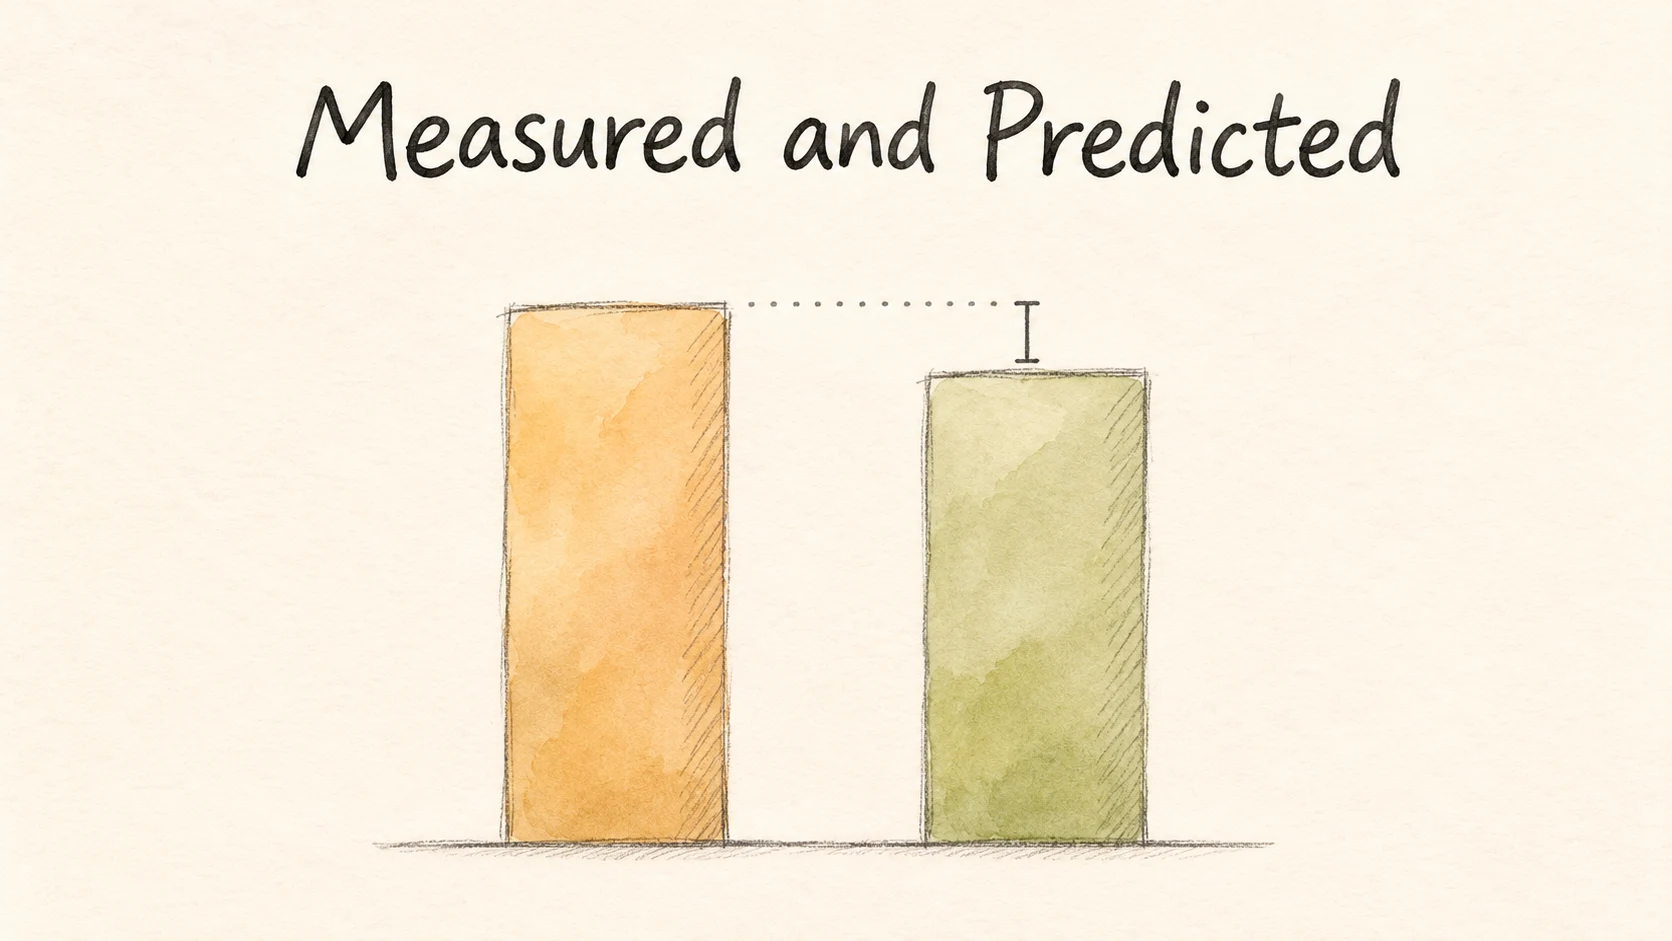
Researchers use the gap to estimate metabolic adaptation. It can depend on which predictors the model uses and what was happening in the body during testing, as well as measurement variability. If a different model predicted 1,420 and you kept the same test result of 1,400, the gap would be 20. The measurement hasn't moved. The comparison value has.
Martins and colleagues combined data from two weight-loss studies, with 171 premenopausal women with overweight. Researchers tested at baseline, after weight loss, and at follow-up after one and two years. The tests followed a planned four-week period of weight stability. After weight loss, measured resting expenditure averaged about 54 calories per day lower than the prediction from body composition, with substantial variation from person to person. In the 46 people with measurements at all four times, the difference was detectable after weight loss but wasn't clearly distinguishable from zero at one or two years. [1]
The Martins analysis compared measurements with predictions for updated body composition. The investigators also pointed out that a few weeks of stable weight could coexist with some ongoing energy imbalance.
Those results came from a particular population. A group average of 54 calories doesn't give you the result for another person who loses the same amount of weight. In the study overall, the short-term resting difference did not predict how much weight people later regained. If you are reading an individual test report, its most direct answer is the resting rate measured under the report's conditions. [1]
Another analysis from Martins and colleagues makes the timing visible. It followed 71 adults and tested them just after a weight-loss phase and then after four weeks of weight stabilization. Measured resting energy use was on average 92 calories per day below predicted just after the weight-loss phase, and 38 calories per day below predicted after four weeks. The gap narrowed between tests in this group. [2]
The timing can matter in your reports too. A test taken when diet and weight were changing quickly and a test taken after several relatively steady weeks capture different moments in the process. Write that information next to the numbers before deciding what to compare. Alongside body composition, the state you were in on the day can help explain the results.
When you compare two reports, look at how they were produced
Start at the heading and units. Was the result obtained in a resting breathing test, or calculated from details such as age, height, and weight? If both are breathing tests, check whether they were done under similar conditions and at a comparable stage. Rest before the test, recent exercise, timing of meals, and whether weight was still changing all matter to the comparison. Researchers set conditions in advance so they can interpret the differences more clearly. [1]
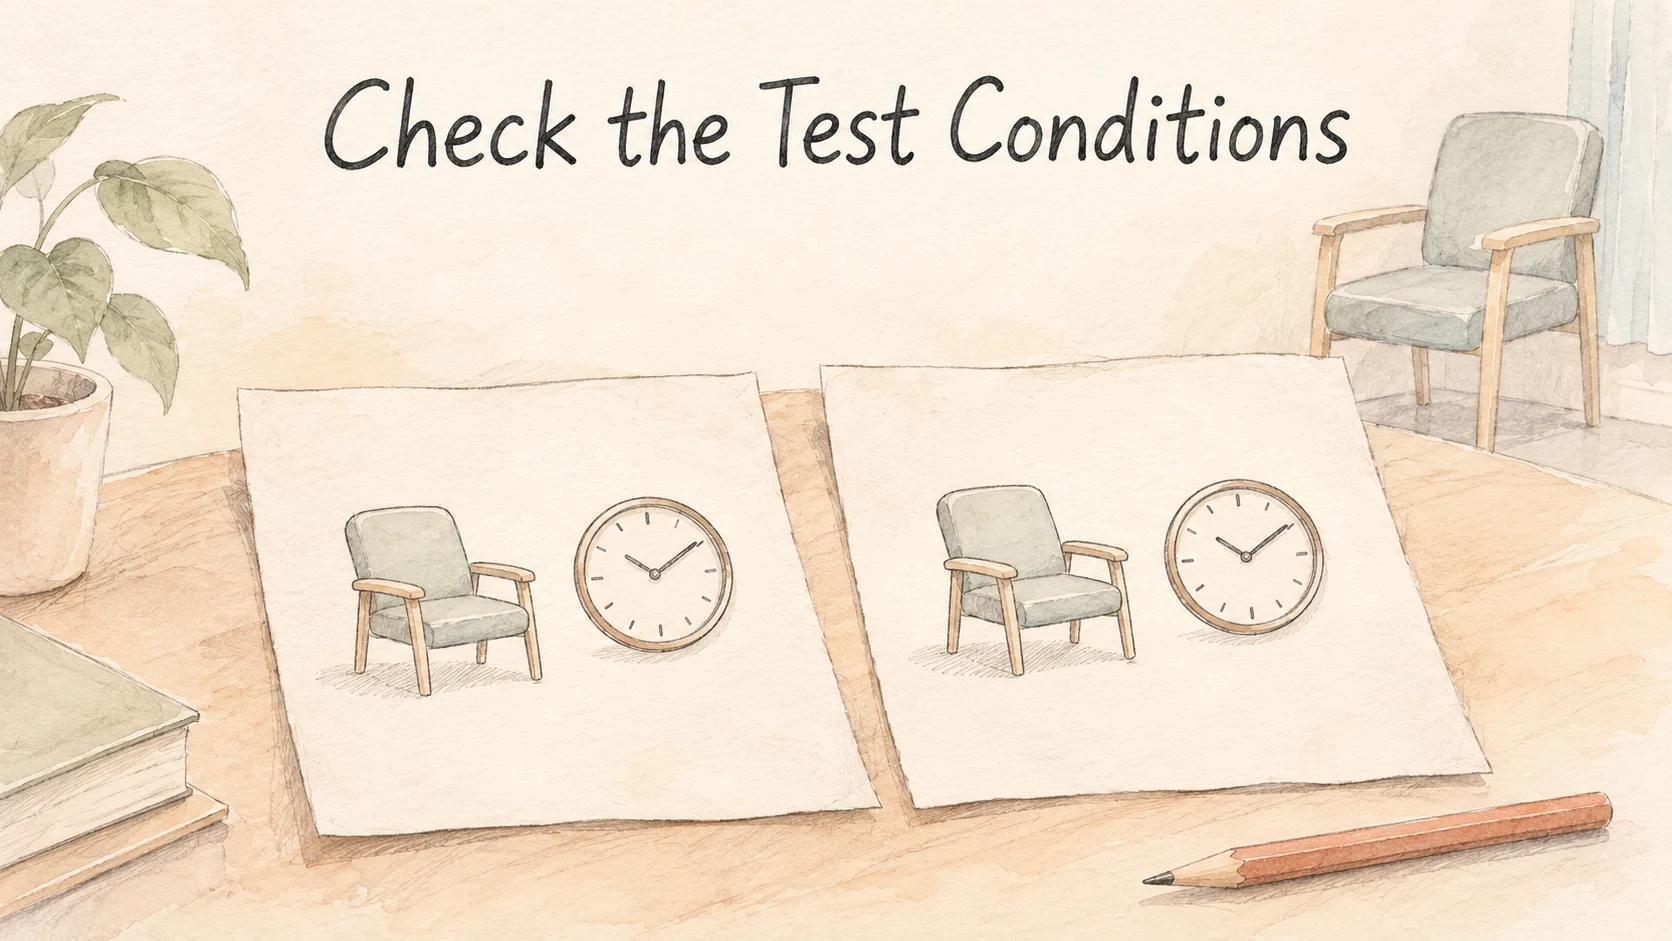
For an estimated number, look at the inputs and whether they include body composition. If both reports are measured values, you can ask the testing service to explain the equipment and how much variation to expect between tests. Some reports give both an estimate and a measurement. Mark those separately. The gap tells you how the tested resting rate compares with the prediction for the current conditions.
It can help to start with the practical question. If you want to know how a new work schedule changed your daily activity, a resting test will leave most of that question open. If the question is how two resting tests compare, look at their preparation and use the same measurement if you can. Keep a separate column for estimates of total energy use. Similar units can still describe different parts of a day.
Return to the two reports and look for the resting rate first. Then check that the prediction corresponds to body composition around the time of the test. With those two numbers labeled and the conditions beside them, you can tell how much the reports say about rest, the estimate, and the difference between them.
References
[1] Martins C, et al. Metabolic adaptation is not a major barrier to weight-loss maintenance. Am J Clin Nutr. 2020;112:558–565.
[2] Martins C, et al. Metabolic adaptation is an illusion, only present when participants are in negative energy balance. Am J Clin Nutr. 2020;112:1212–1218.