
How to Read Your Weight With a Seven-Day Average
Two sample weeks show how to compare daily readings, weekly averages, and a rolling seven-day average. Includes tips for consistent measurements and missing days.
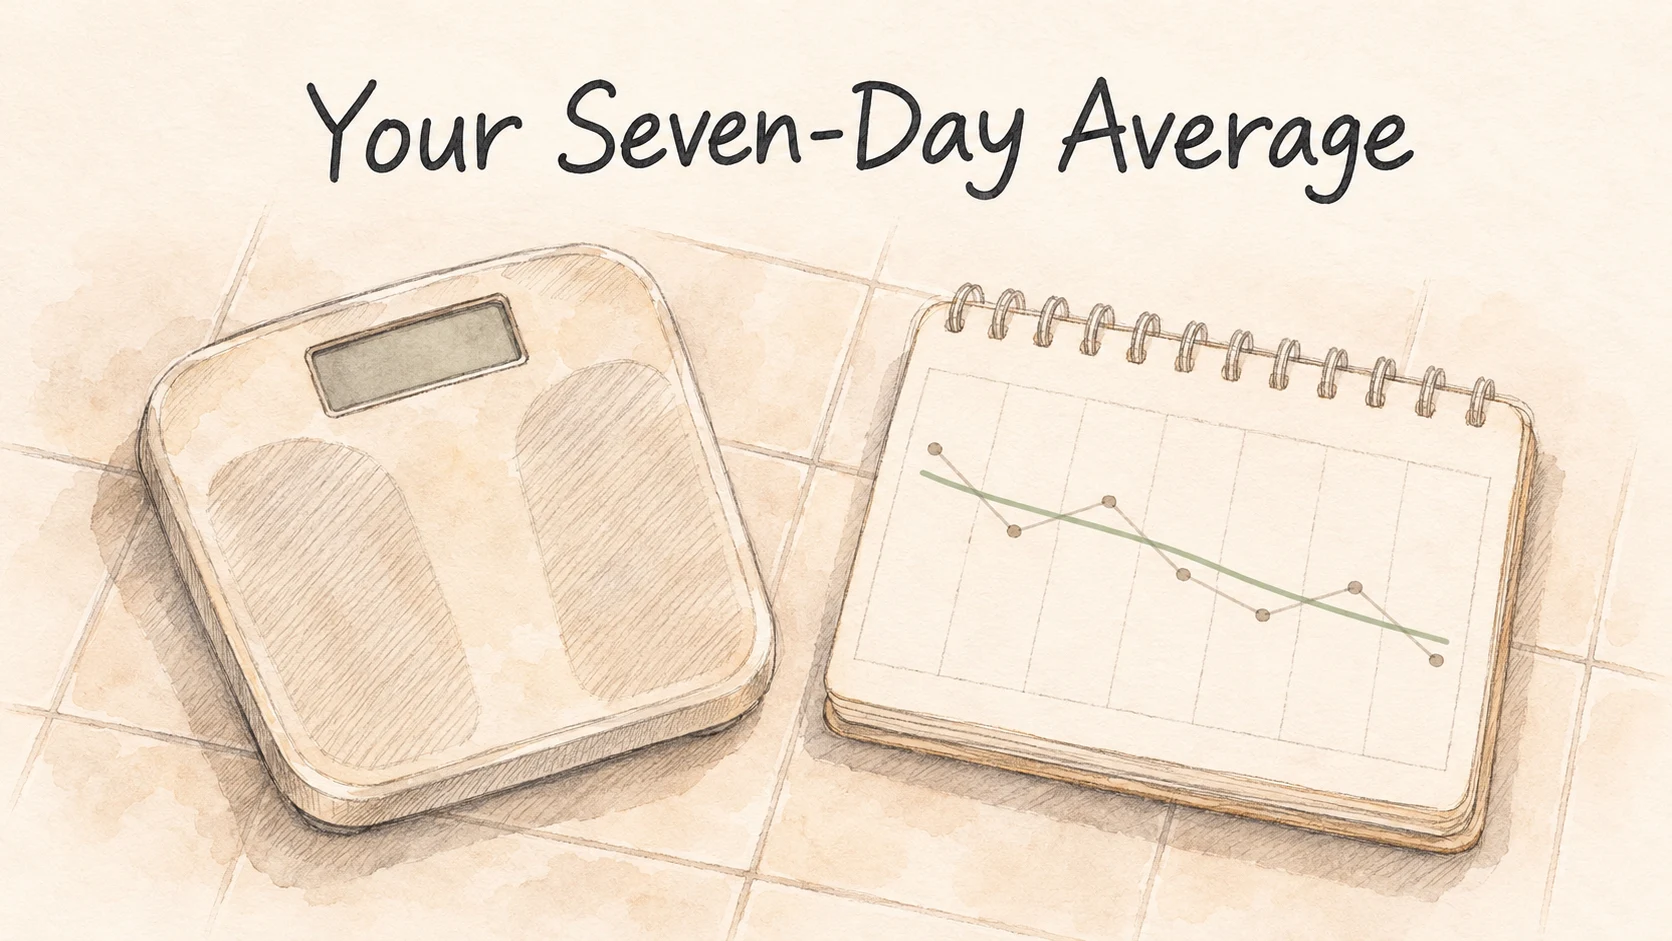
Last Sunday your scale read 70.3 kilograms. This Sunday it reads 70.5. Those two readings are up by 0.2 kilograms, but the second week's average can still be lower. If you're looking for a longer direction, average seven readings taken under similar conditions and compare that result with the next week.
The scale weighs everything you bring onto it at that moment. It answers how much you weigh in that moment. Put dates next to those readings and you can still see which days were higher or lower, while the average gives each week's readings a single point you can compare over time.
Keep the conditions similar across measurements
Keep the same scale on a firm, level floor. Pick a time you can repeat easily. For example, weigh after getting up and using the bathroom, before having anything to eat or drink. Wear similar light clothing, stand steady on both feet, and note the result once the display settles. If you use scales at the gym, try to use the same set of scales at a similar point in your visit. [1][2]
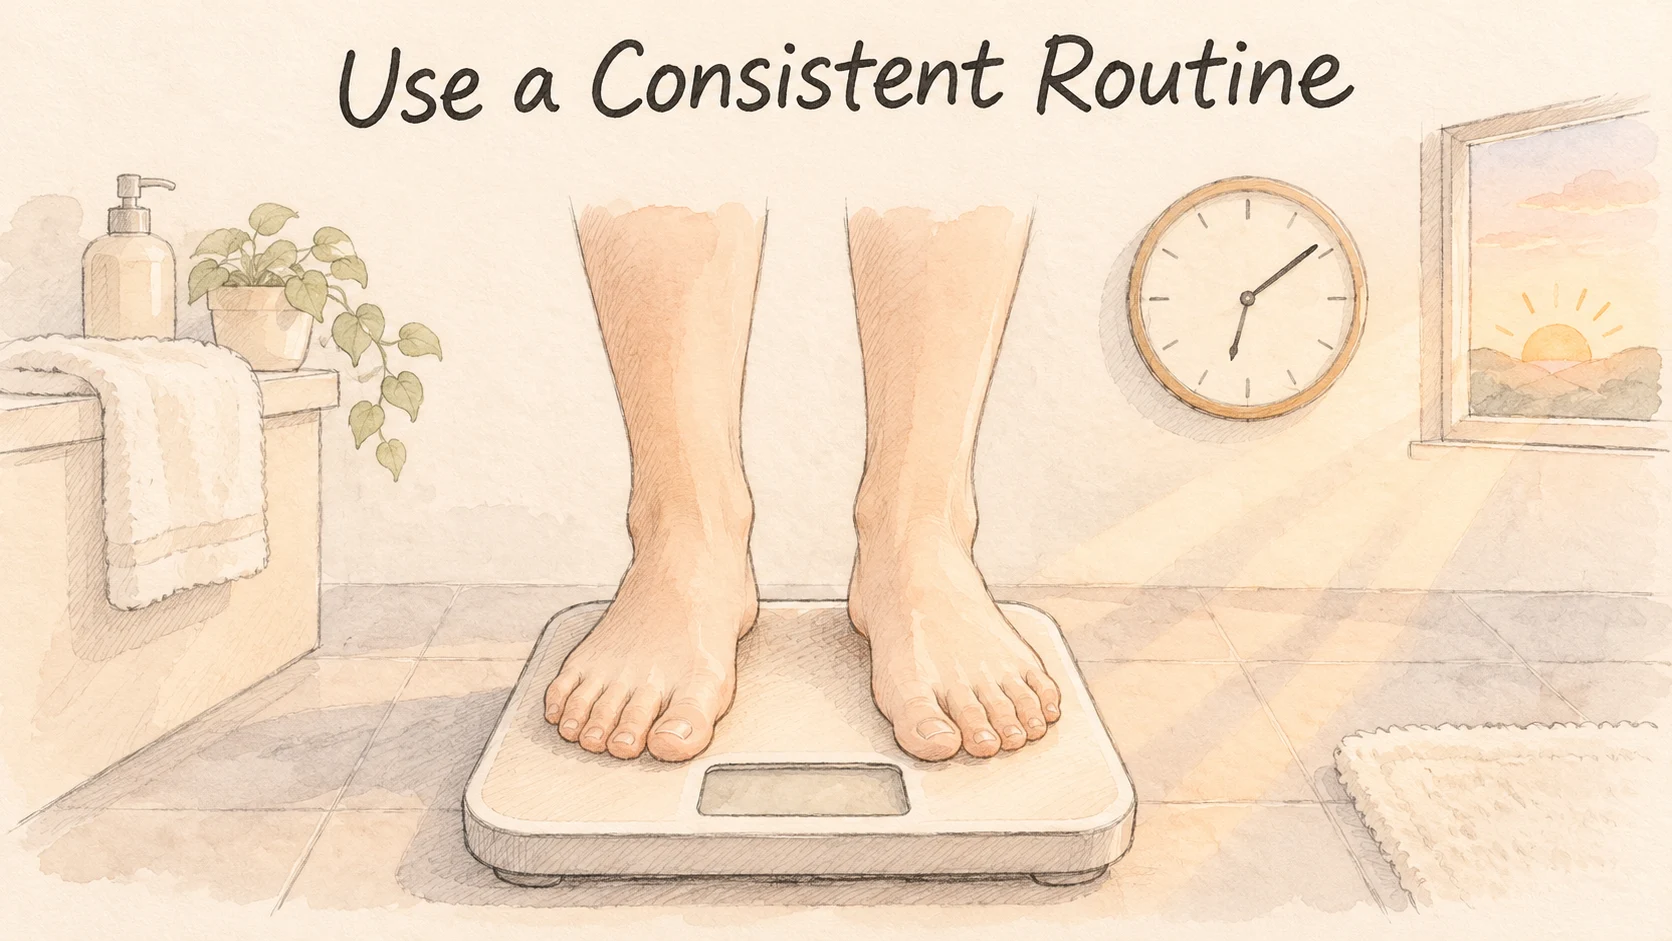
It may be easier to record the conditions than to arrange them perfectly. If you remember to step on the scale after breakfast, mark the reading as after breakfast. When you see it again later, you'll have that piece of context. If you travel or switch scales, note that too. Later on, you can see which measurements were taken under the most similar conditions.
Researchers from the European NoHoW project analyzed weight records from 1,421 people taking part in a weight-loss maintenance study. They separated out longer-term weight trends and compared how far each day of the week sat above or below those trends. The group tended to be heavier on Monday and lighter on Friday. The fluctuation was around 0.35% of body weight, or about 0.3 kilograms in this group. Your days off and work schedule can give you a different pattern. [3]
The NoHoW analysis describes a group pattern after accounting for long-term trends. The 0.35% is an observation about that group, with room for individual readings to move by different amounts.
Morning is one convenient reference point. An evening routine can also give you comparable measurements if you can repeat it. For example, you might reliably get home at about the same time. Write down when you weighed and keep those evening readings together. When you return from a trip and go back to your usual scale, mark that point in the record too. That makes it easier to see whether an apparent jump continues on your home scale.
The Sunday reading can rise while the weekly average falls
Here are two weeks to try with a calculator. Suppose you weighed from Monday to Sunday both weeks. In the first week, the readings were 70.4, 70.6, 70.2, 70.4, 70.1, 70.0, and 70.3 kilograms. They add up to 492.0. Divide by seven and the week's average is about 70.29 kilograms.
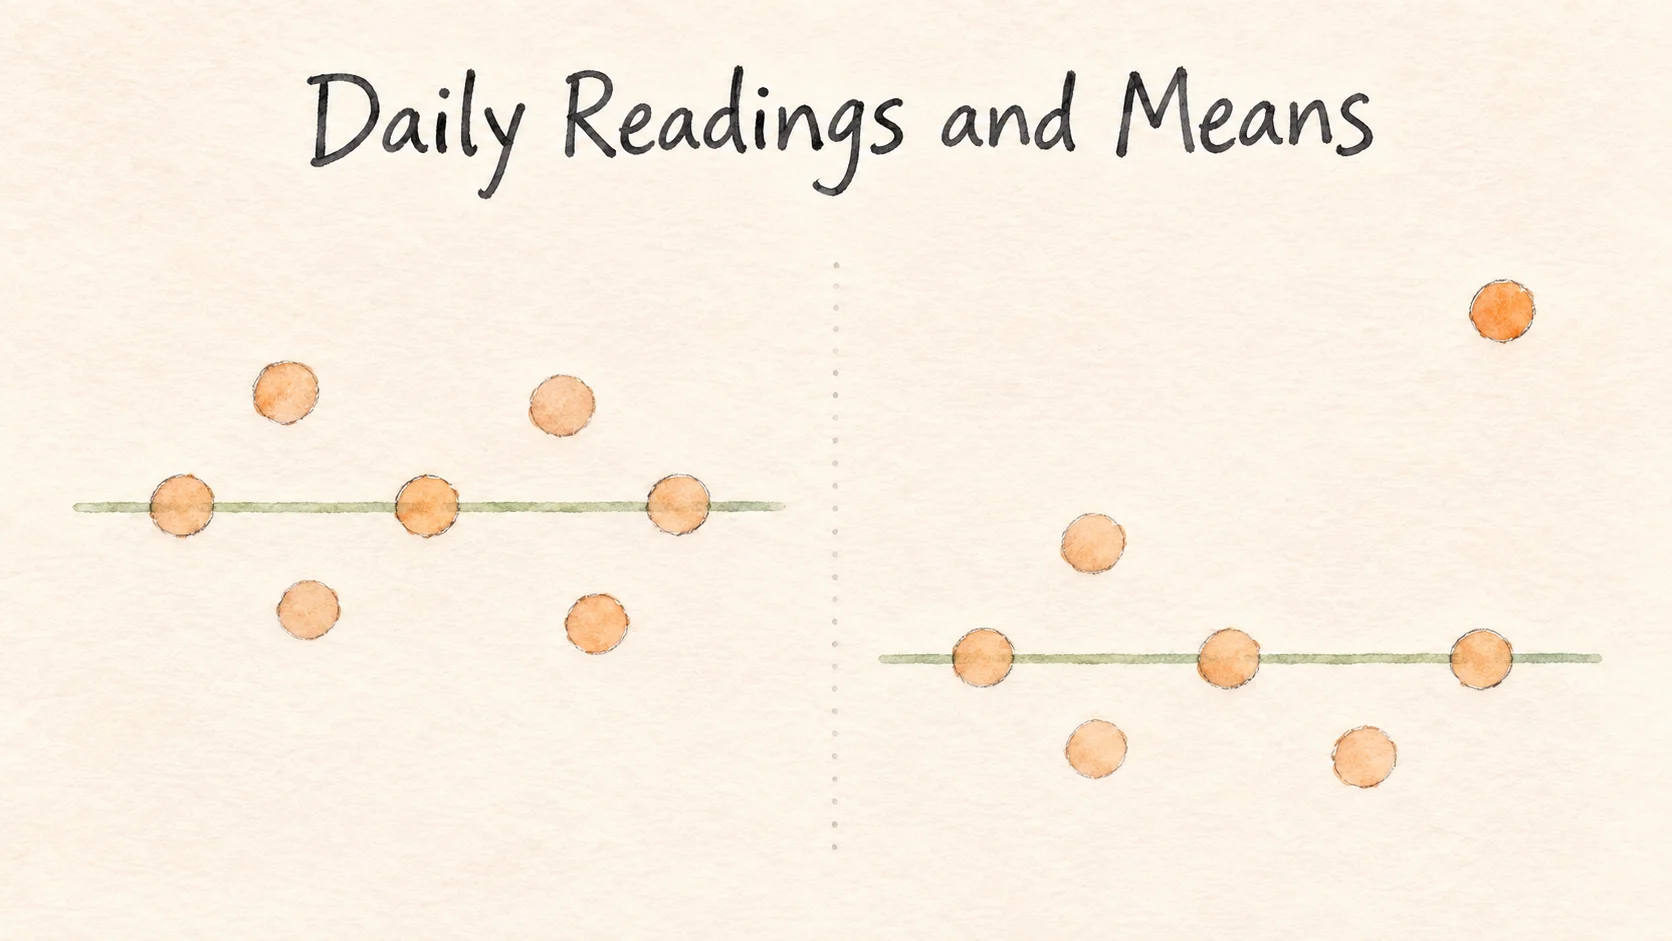
In the second week, the readings were 70.1, 70.0, 69.9, 69.8, 70.1, 69.9, and 70.5 kilograms. The total is 490.3, and the average is about 70.04 kilograms. Here, the second Sunday is 0.2 kilograms higher than the first Sunday, while the second week's average is about 0.24 kilograms lower.
It helps to save rounding for the last step. Subtract the totals first and the difference is 1.7 kilograms. Divide that by seven for about 0.243 kilograms, which rounds to 0.24. If you just subtract the two displayed averages, 70.29 and 70.04, you get 0.25 because each number was already rounded. The extra decimal in an average helps with the arithmetic. The scale itself still measures to the same degree of precision.
If you plotted these two weeks, each day's reading could be a dot and each week's average a short line. One dot can pull its line up a bit. The other six still have a say. Several more comparable weeks would help show whether the example is the start of a longer direction. Picking only the highest or lowest points answers a different question.
You can estimate the influence of one high point. Suppose six readings stay exactly the same while one increases by 0.7 kilograms. The total rises by 0.7, so the weekly average rises by only 0.1. A fixed weekly average includes the change once, in that week. In a rolling average the high point stays in the calculation until that date falls outside the last seven days. You can still see it in the daily record.
A weekly average and a rolling average use different windows
A fixed weekly average starts and ends on the same days each week. If you choose Monday through Sunday, work out the average on Sunday, then start a fresh set on the next Monday. To update daily instead, look back seven days including today. On the next day, drop the oldest reading and add the latest one. That's a seven-day rolling average.
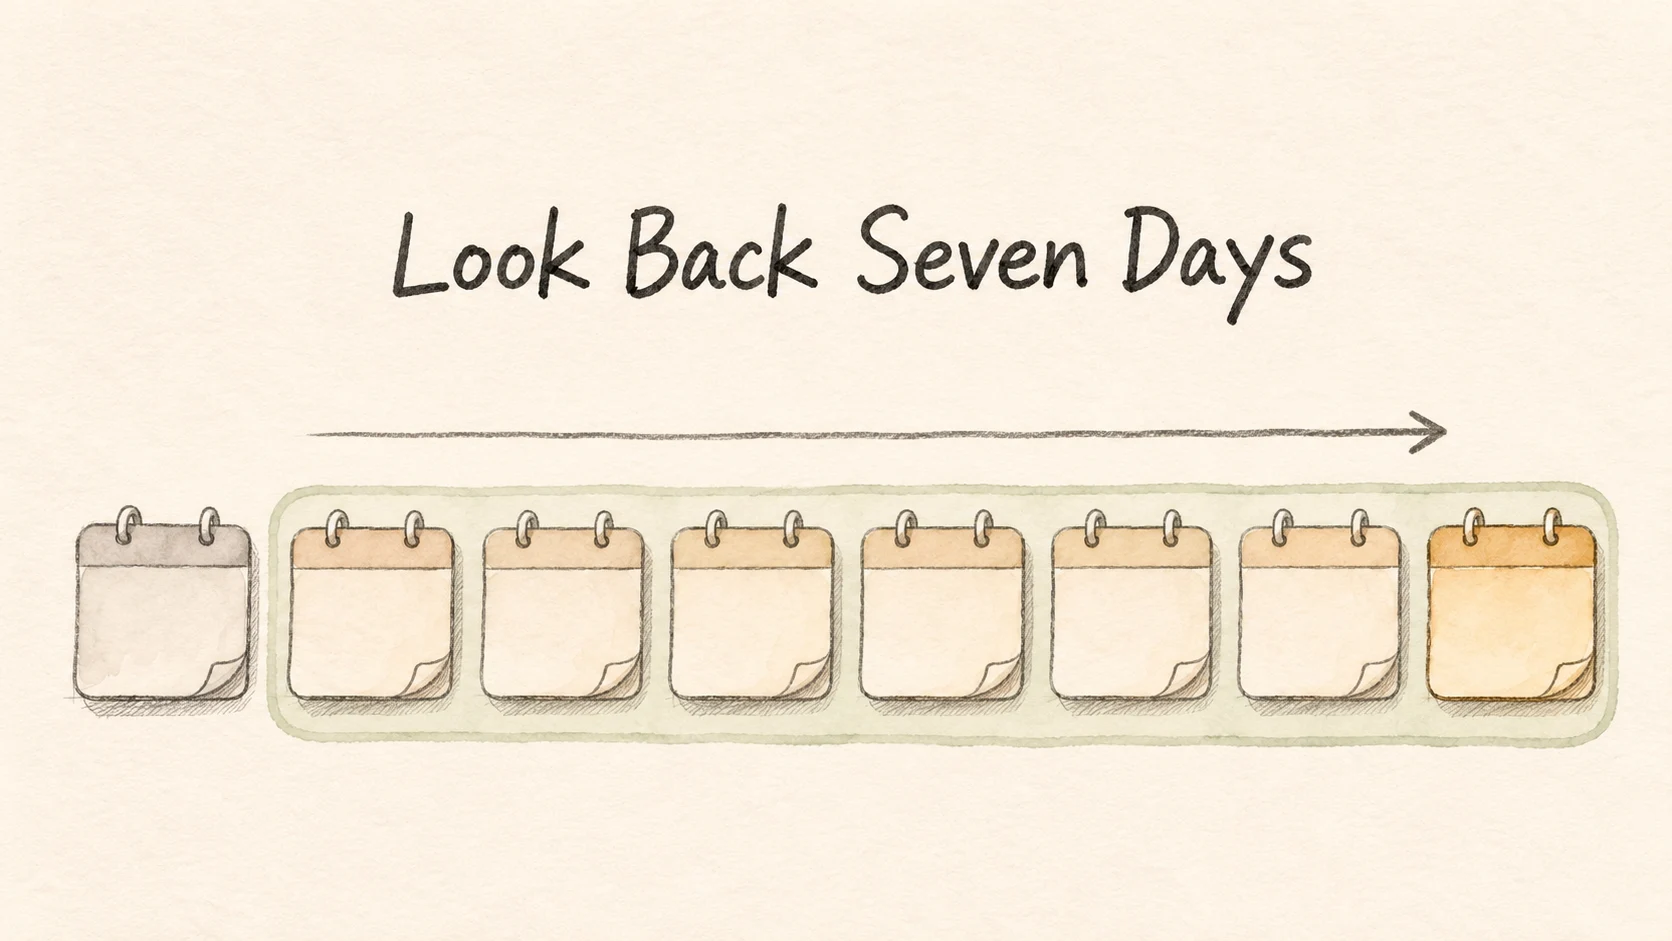
Start with the first week's total of 492.0 kilograms. The next Monday, remove the old Monday's 70.4 and add the new Monday's 70.1. The new sum is 491.7, so the rolling average is 70.24 kilograms. Six of the seven readings are still the same as the day before. That's why the line moves more gradually and can take several days to reflect a new change fully.
Leave a blank for a day you didn't weigh. If you compare a week with five readings to one with seven, write down the number of readings and notice which days are missing. An average made from Monday through Friday speaks to those five days. A weekend reading might move it. One measurement can stay in the record as a single reading, and you can return to it when you have another comparable day.
Leave space for three things in your notebook. Write down the date, your weight, and anything unusual about the conditions. At the end of the week, count the readings when you work out the average. If you need to skip a day, your other observations are still there. You can label a result as an average of six readings, or wait until you have another full week to make a cleaner comparison. The notes let you see what went into the average when you look at it again in a month.
Averages are an option for making sense of records you choose to keep. If daily weighing makes you want to keep stepping back on the scale, use an interval that feels more comfortable. Weighing under similar conditions on the same day each week, or less often, can still give you a record over time. [1] Next Sunday, note the conditions, then put the day's result back into the time span you chose. It can be a higher day in a lower week.
References
[1] NHS England. How to record your weight. 2023.
[2] East Lancashire Hospitals NHS Trust. Body measuring techniques.
[3] Turicchi J, et al. Weekly, seasonal and holiday body weight fluctuation patterns among individuals engaged in a European multi-centre behavioural weight loss maintenance intervention. PLOS ONE. 2020;15:e0232152.