
Same Waist, Different Fat. Where Are the Two Abdominal Fat Depots?
The abdominal wall separates two fat depots. See how MRI measures them and what a tape measure, a pinch, and a single image can tell you.
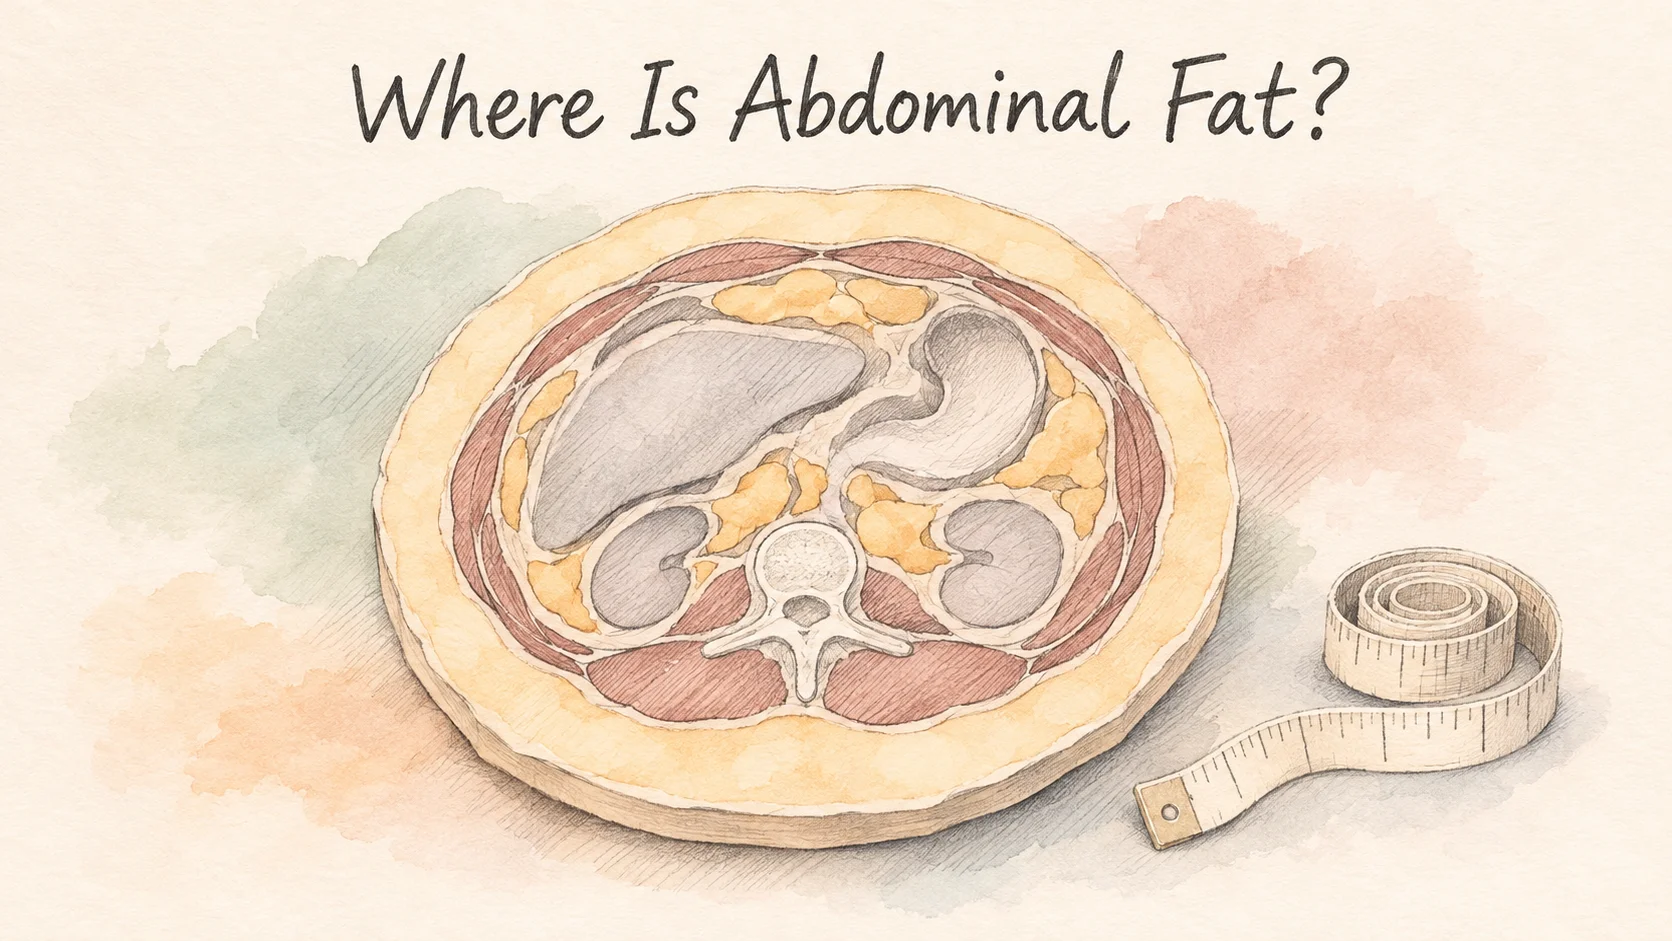
Two people measure the same around the waist. Can you tell from the outside which person has more visceral fat? The tape goes around the outside of the abdomen. The divide between the two fat depots lies inside it. Subcutaneous fat sits between the skin and the abdominal wall. Visceral fat sits inside that wall, around the organs. The same waist measurement can go with very different proportions of the two [1].
With magnetic resonance imaging, or MRI, researchers can take a series of cross sections through the abdomen and separate the fat on either side of the wall. Even on a scan, the level you choose matters. In a study of 820 people, changing the location of a single image reduced the proportion of people whose ranking shifted substantially from one in four to about three in a hundred [1].
The abdominal wall separates the two depots
Picture a cross section across the abdomen. At the edge is skin. Underneath it is a layer of subcutaneous fat. The abdominal muscles form a wall separating those outer tissues from the cavity that contains organs. Inside the wall, you can find fat in the spaces around and between structures such as the intestines. Tracing the wall on an image lets researchers measure the two areas separately [1].
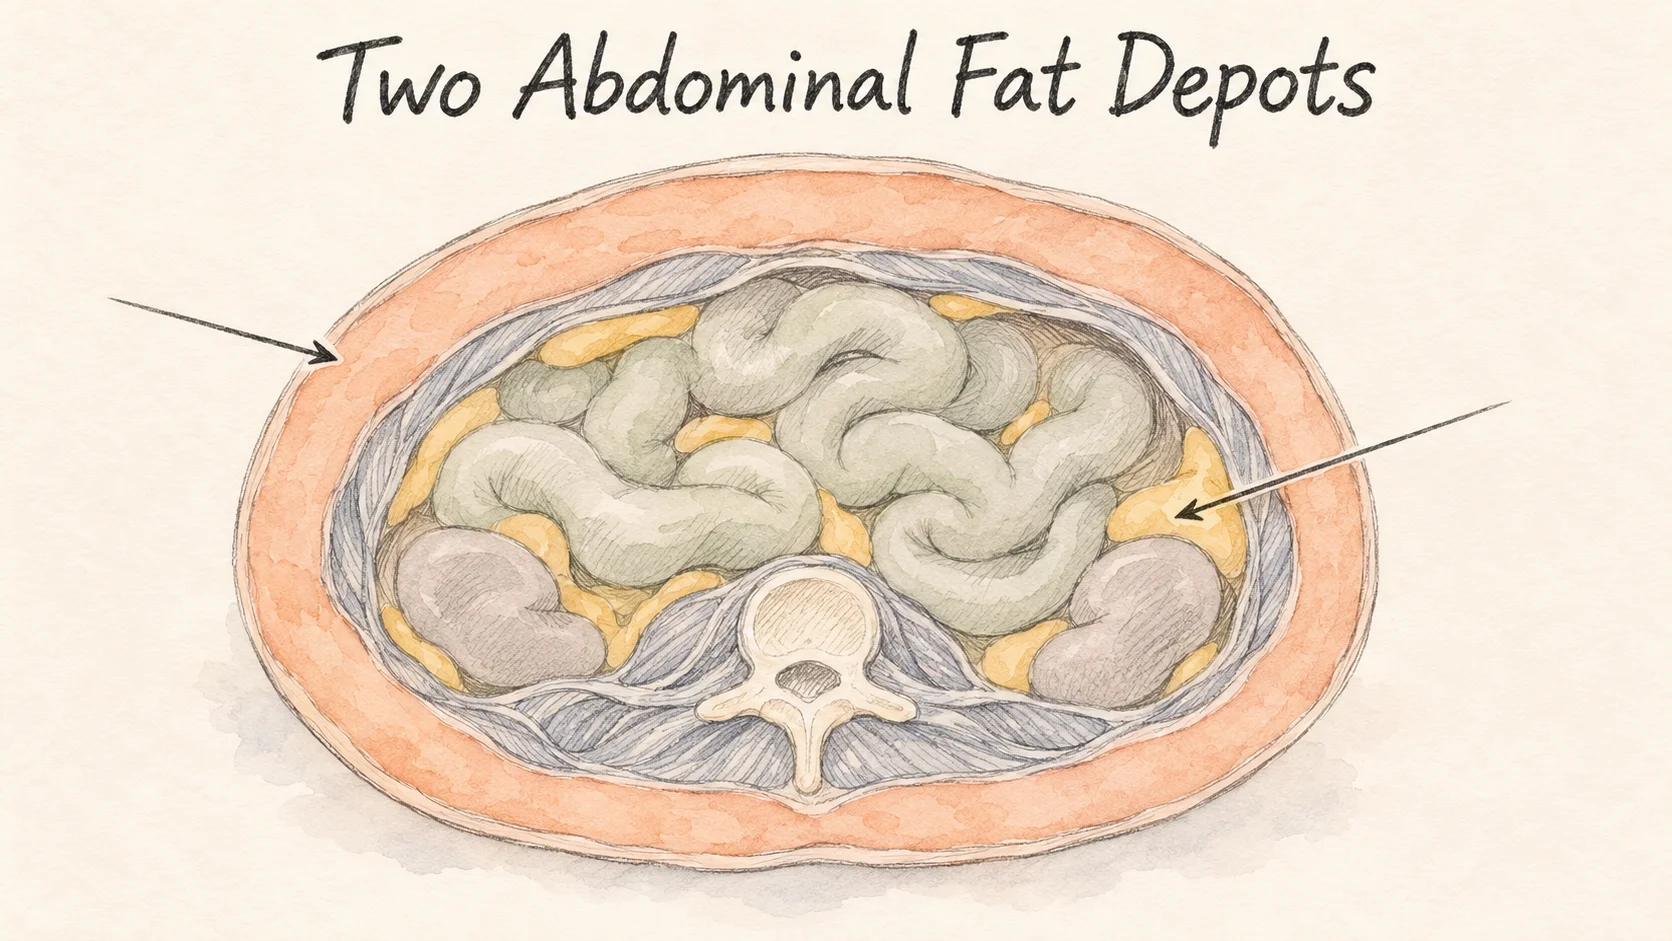
If you pinch a fold at your waist, you hold skin and some of the tissue just beneath it. Your fingers stay outside the abdominal wall. How far the abdomen projects or how firm it feels can also be affected by posture, tension in that wall, and what's inside the abdomen. You can see a change in the shape of your waist or feel a change in the fold without knowing how much visceral fat it contains.
The study's reference to fat around organs has a specific meaning. Researchers traced fat tissue within the part of the abdomen they had defined. The fat content within liver tissue is a separate measurement. A liver and nearby fat may both appear in one illustration, and they describe two different locations.
The same waist can contain different proportions of fat
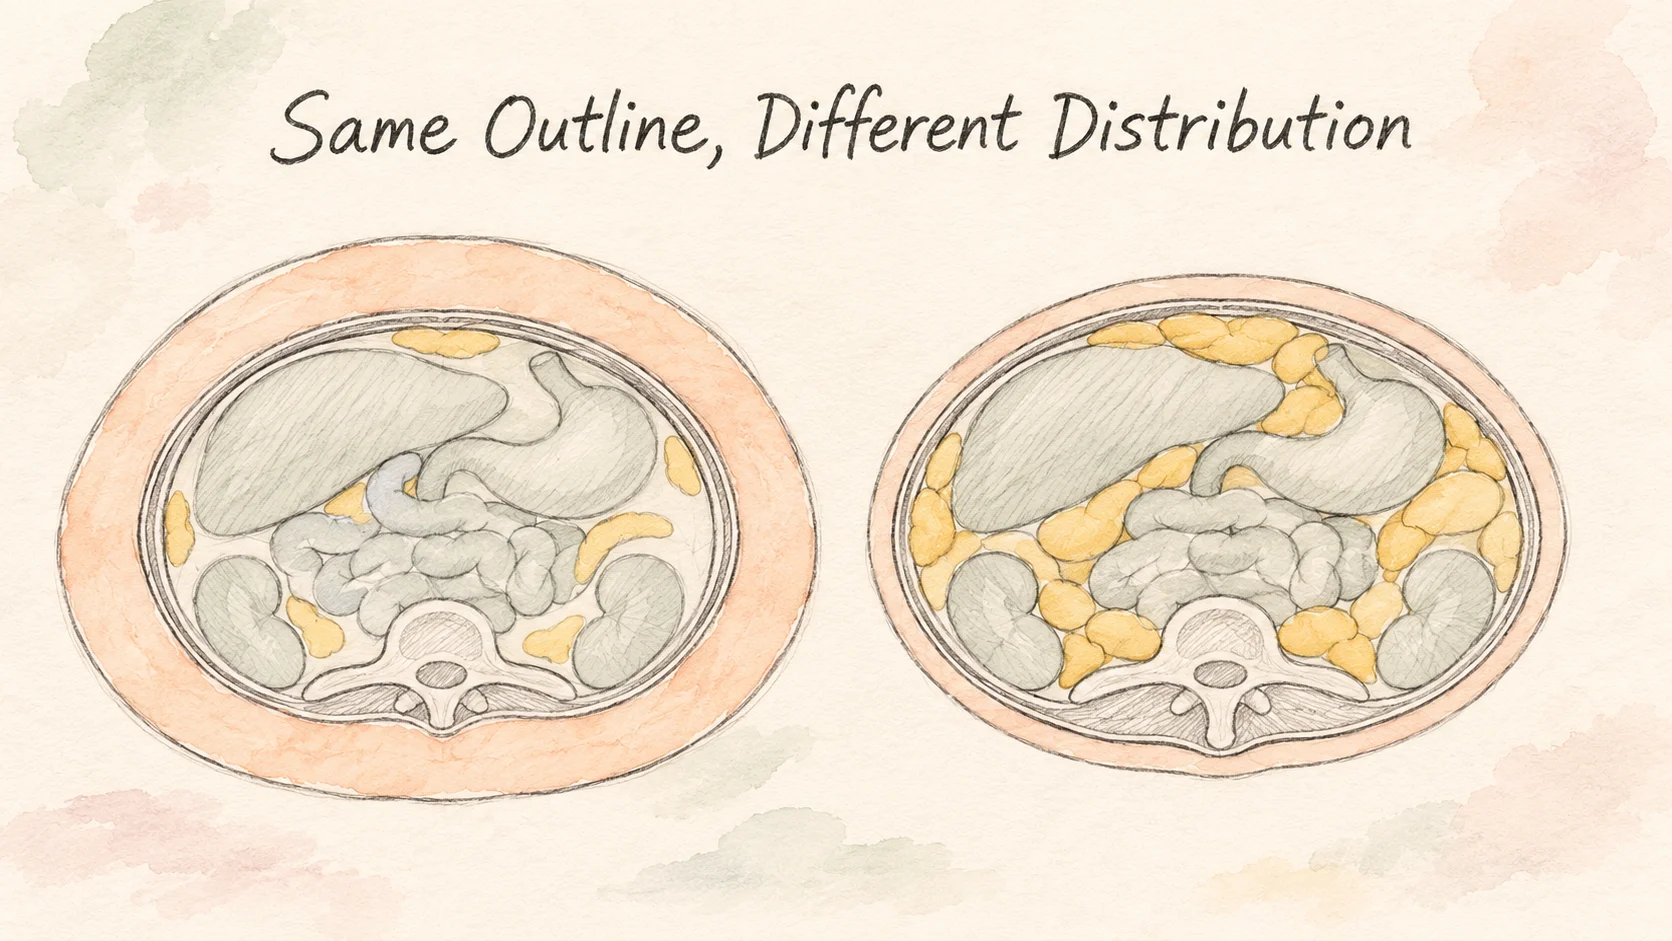
A measuring tape gives a circumference. It runs around everything within that line, including the two fat depots, muscle, and other tissue. Picture two cross sections with the same outline. One has a thicker layer just beneath the skin. The other has more pockets of fat around the internal organs. The drawing illustrates that possibility. To know how the fat is distributed in a real person, researchers need more than the outside measurement.
The 820-person MRI study measured abdominal circumference as well as fat volume. In that sample, people with larger circumferences tended to have more visceral fat, with room for differences between people at the same circumference. The tape measurement explained less of the variation in volume than the single MRI slice chosen to best represent it. A change in your waist measurement therefore tells you something about your outside dimensions. Separating the fat depots calls for a measure that can see the difference [1].
In the MRI sample, two groups of men did not differ significantly in average abdominal circumference, but their average measured visceral fat volumes were 2.48 and 3.40 liters. Each average came from a group with a range of measurements. It gives a real example of why a group’s external measurement and the amount of fat inside the wall need to be measured separately [1].
A Framingham Heart Study analysis used computed tomography, or CT, to measure abdominal fat volumes in 3,001 adults. The researchers compared the fat depots with indicators such as blood pressure and blood glucose measured in the same period. Both depots were related to some indicators, and visceral fat was more strongly related to several of them. That is a comparison across people at one point in the study. Finding out what a depot causes would require different evidence [2].
From one cross-sectional area to a volume
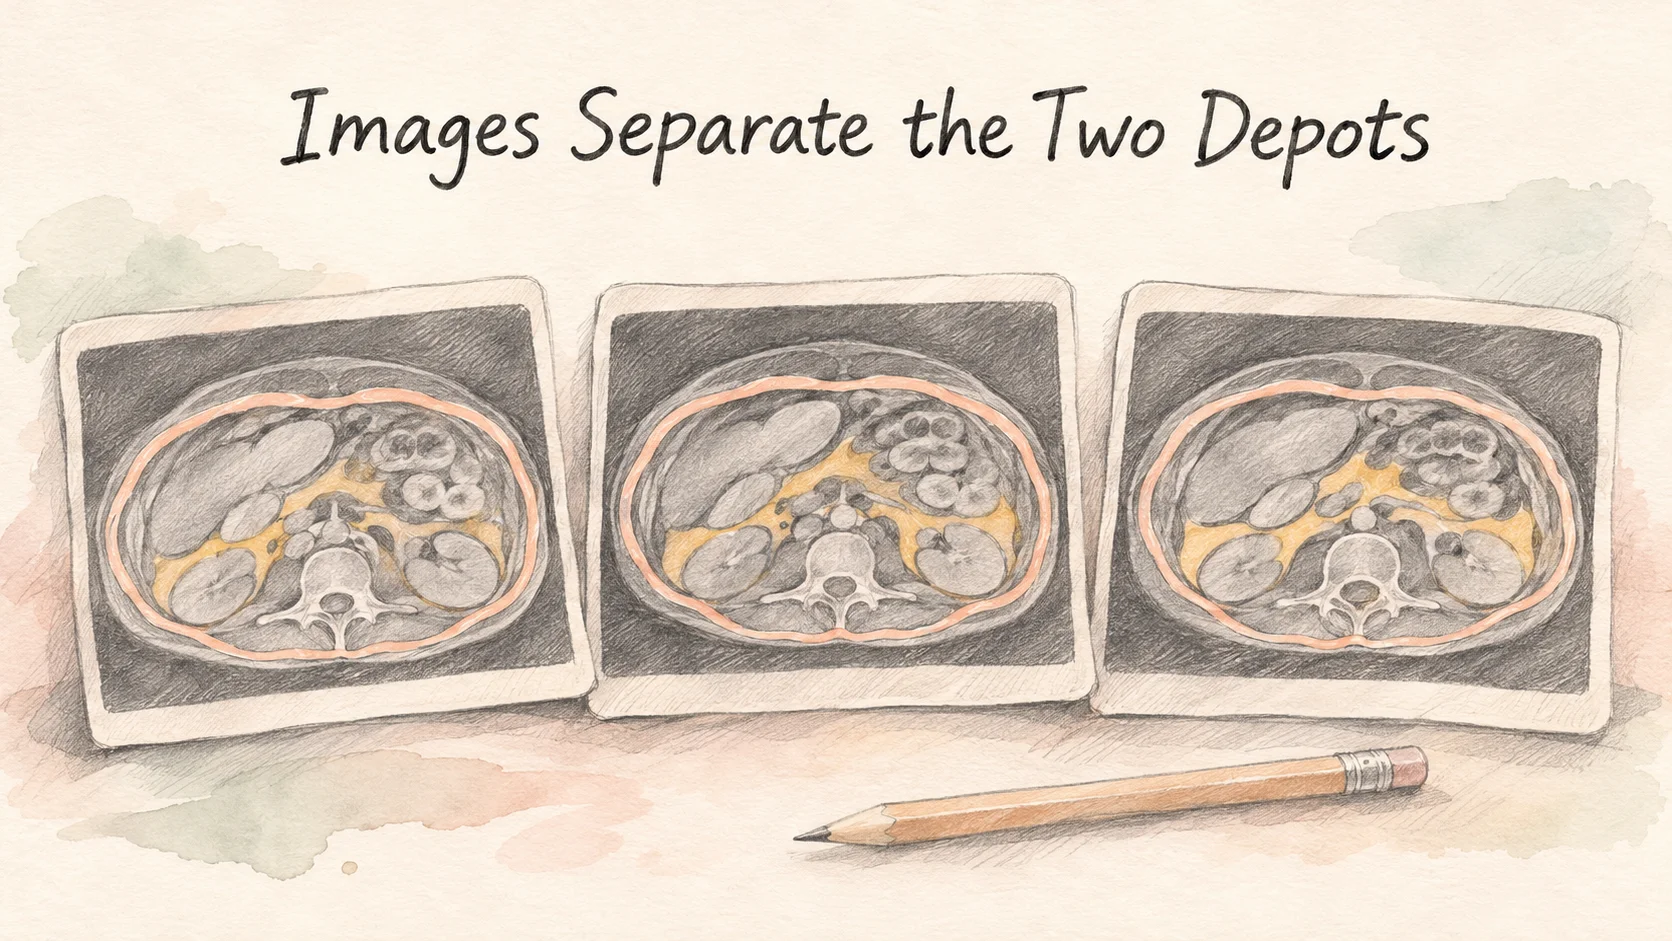
To work out a volume, researchers trace the wall in each image and outline the fat on both sides. Each picture gives a cross-sectional area, which can be reported in square centimeters. For a simple example, imagine two contiguous slices that are each one centimeter thick. If the areas marked as visceral fat are 80 and 100 square centimeters, the combined volume in those two slices is about 180 cubic centimeters. Measuring an entire region takes the areas and thicknesses of all the slices it includes [1].
For each participant, the study acquired 21 to 40 slices, depending on height. The fat measurements began at the top of the liver and ran down to the boundary between the last lumbar vertebra and the sacrum. The study methods describe both the thickness of the slices and the region that counted. Two papers using the same word “volume” could cover different lengths of the abdomen [1].
The MRI team compared that approach with an estimate made using just one slice. Its sample included 820 adults aged 18 to 88. Using the area between the fourth and fifth lumbar vertebrae explained about 83% of the differences in total visceral fat volume across participants. Moving the slice six centimeters higher brought that figure to about 97%. The percentage describes how much of the variation in volume the model explained across the group. It is not a percentage of an individual's fat captured in the picture [1].
The researchers also ranked everyone by volume and then ranked them again by area on one slice. Using the lower slice moved about 25% of participants at least 82 places in the ranking. Using the higher slice moved about 3% of participants that far. A different position in the scan changes what lands within the image, even though the person's abdomen remains the same [1].
Keep the method alongside the result
If you're recording waist measurements with a tape, keep the measurement site and date with the number. That gives you a record of the outside dimension. If you already have an imaging report, look for an area in square centimeters or a volume in cubic centimeters or liters, and check the slice level or the region covered. Those details matter whenever you set two results side by side.
Suppose one report lists 90 square centimeters at a named level and another lists two liters for a whole region. You can rewrite two liters as 2,000 cubic centimeters, and it will still be a volume. Keep the two measurements on separate lines so a later result of the same kind has a clear comparison.
The two waist measurements at the start tell you the people were the same around that spot. To find out how their fat was distributed, you would need measurements that distinguish what's inside and outside the abdominal wall.
References
[1] Demerath EW, et al. Approximation of total visceral adipose tissue with a single magnetic resonance image. Am J Clin Nutr. 2007;85(2):362–368.
[2] Fox CS, et al. Abdominal visceral and subcutaneous adipose tissue compartments: association with metabolic risk factors in the Framingham Heart Study. Circulation. 2007;116(1):39–48.