
Why Does Your Scale's Body Fat Estimate Change From Morning to Night?
A home scale turns impedance and other inputs into a body fat estimate. See what happened after a drink of water and how weight readings compare with body composition estimates.
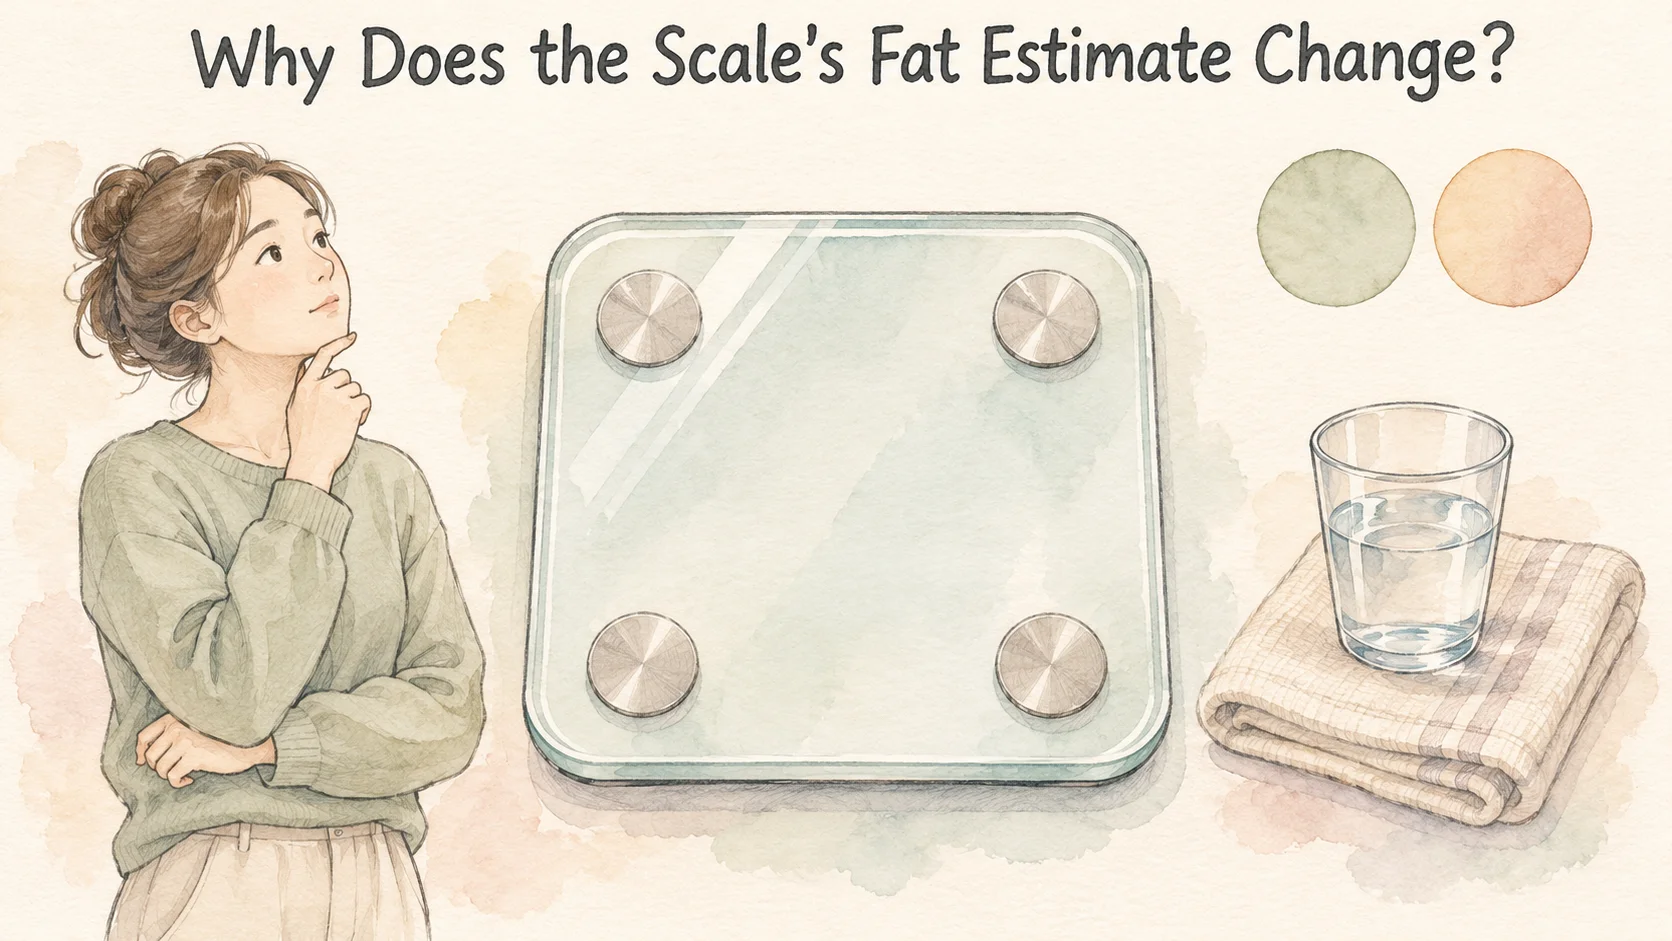
The scale shows 24% body fat in the morning and 25% in the evening. Even on the same scale, contact with the electrodes, the distribution of water in the body, and the timing of the reading can affect its inputs. A body fat scale measures weight and electrical impedance, then uses a model to estimate body fat. An unexpected reading is a reason to look at the measurement conditions [1, 2].
In an experiment with 76 people, the estimated body fat percentage rose by an average of about 1.1 percentage points 20 minutes after a 591-milliliter drink of water. The experiment measured a change in the device's result. That is a different kind of change from gaining body fat [1].
What are the metal pads measuring?
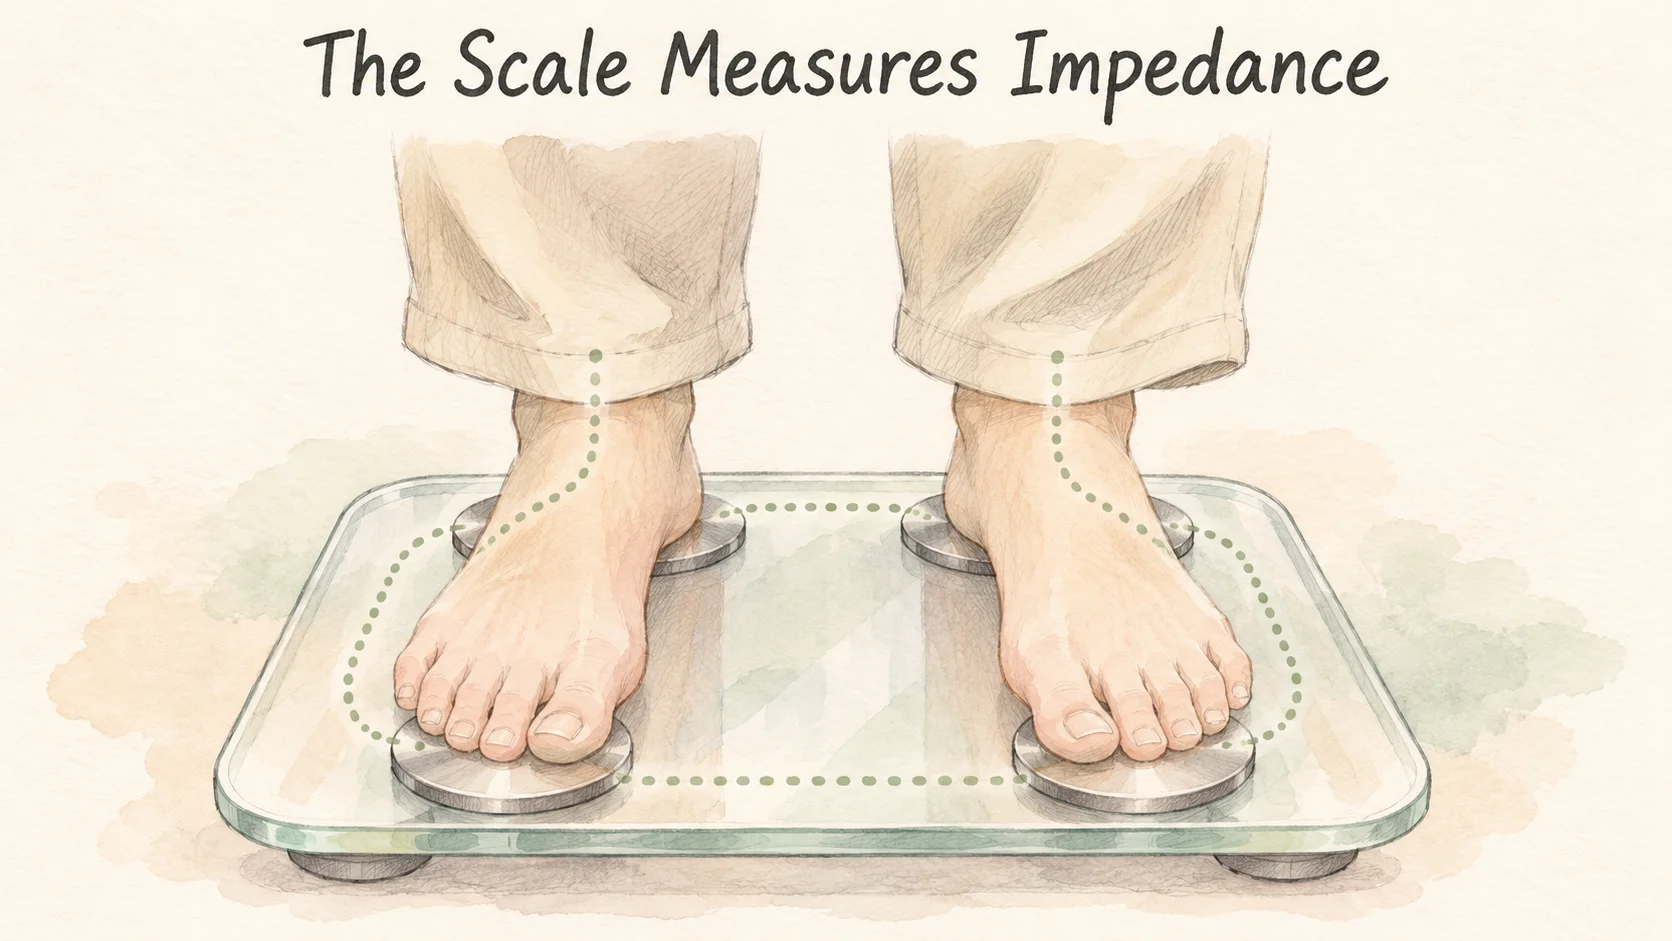
Many home body fat scales use electrodes under the feet. They send a small electrical current and measure bioelectrical impedance, the opposition tissues present to the signal. Water and electrolytes affect how the signal passes through the body. A device that measures foot to foot uses the lower-body signal to estimate the composition of the whole body [2].
Weight usually appears before the body fat estimate. The weight comes from the scale platform. The fat percentage comes from a model that uses the impedance together with details such as height, weight, and age. The position of the feet and how much of each foot contacts the electrodes can affect the signal. The two numbers may appear next to each other, but one is a weight reading and the other is an estimate that takes more inputs [2].
Some devices take measurements from the feet only. Others add hand contacts and estimate the signals for several parts of the body. Changing from the scale in a gym to the one at your house can therefore change both the measured path and the model. The final percentages don't show those steps on the screen [1, 2].
Imagine that you weigh 70 kilograms and the scale estimates 24% body fat. Multiply the two and the implied fat mass is 16.8 kilograms. At the same weight, a reading of 25% would imply 17.5 kilograms. The two estimates differ by 0.7 kilograms. Those numbers show how a one-point change can look bigger when expressed as kilograms. The arithmetic does not show that the amount of fat tissue changed by that much.
How could a drink change the body fat estimate?
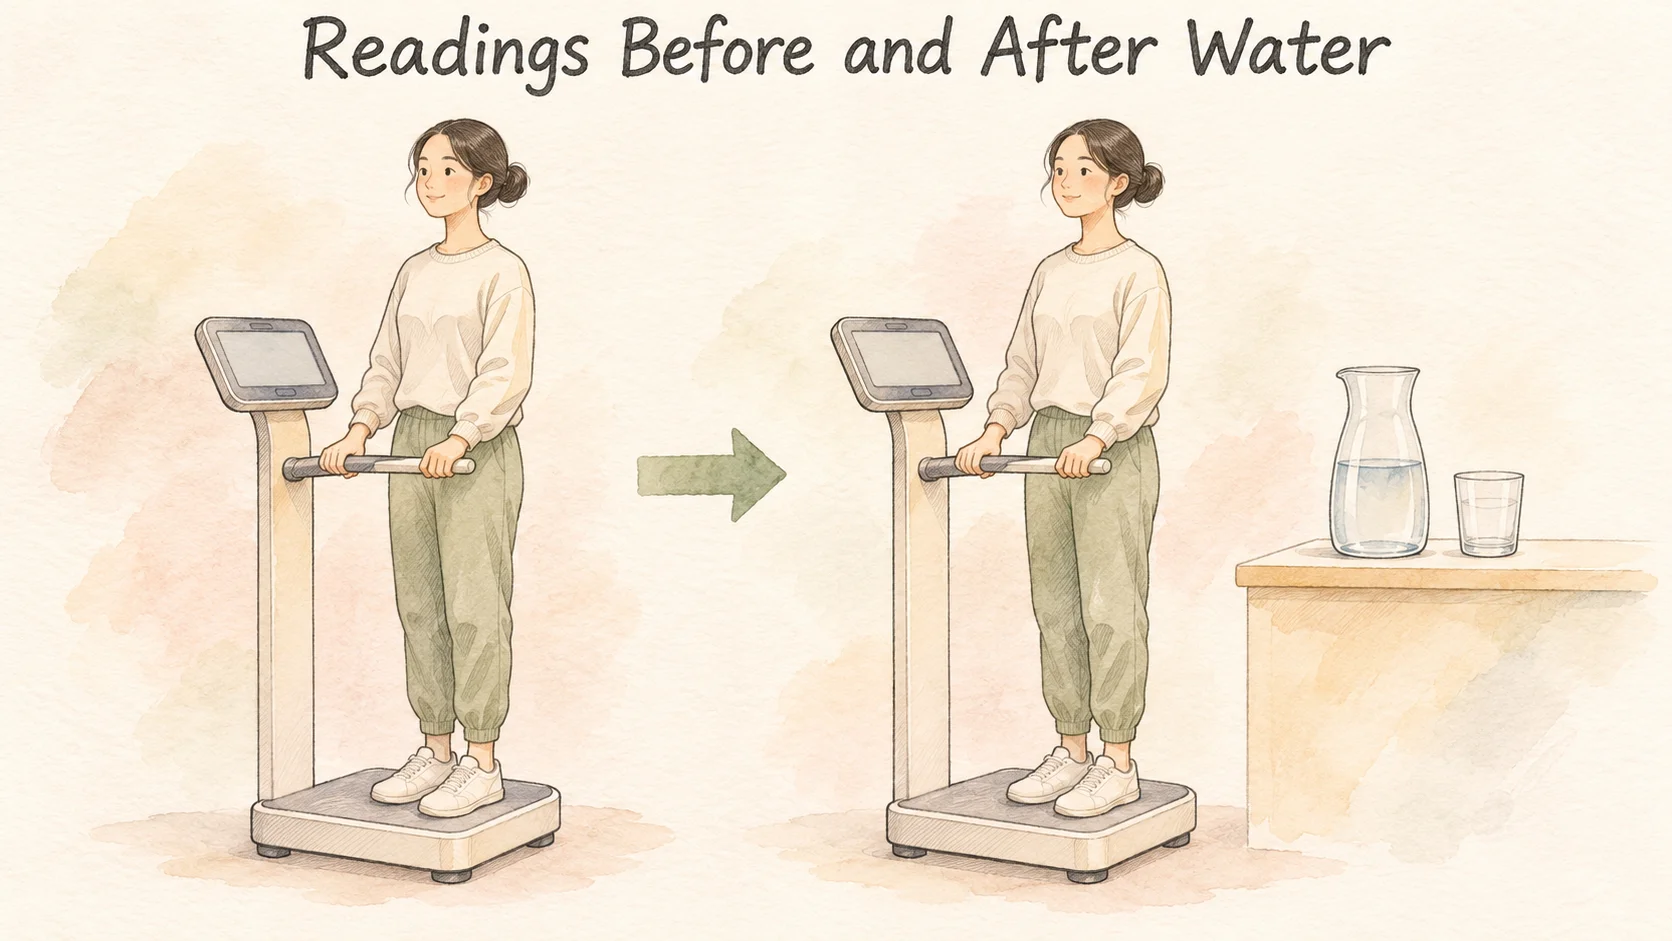
A U.S. study enrolled 76 healthy, recreationally active adults, with an average age of 21. Each person had three sessions with a segmental impedance device. After a baseline measurement they drank 591 milliliters of water, the same volume of a drink with carbohydrate and electrolytes, or nothing. They were measured again after 20, 40, and 60 minutes. The session without a drink helped researchers compare changes that occurred as time passed [1].
After 20 minutes, the estimate was 1.1 percentage points higher with water and 1.2 points higher with the other drink. Body weight and impedance also increased. In the session without a drink, the estimated fat percentage was 0.3 and 0.5 percentage points above baseline at 40 and 60 minutes, respectively. Those are averages from a particular device and group. A different device or time of measurement can produce a different pattern [1].
Drinking water adds to your weight, and the water moves through the body over time. The electrical signal passes through the parts of the body sampled by the device. The model takes that signal and the new body weight and estimates how much of the total belongs in each category. A change that started with a drink can therefore show up on the body fat line. The label on the screen describes what the device estimates after doing the calculation [1, 2].
A second crossover study followed 20 adults for about an hour on a vertical impedance device. Each participant tried a water session and a no-water session, with measurements every ten minutes while they stayed upright. The device allocated the extra weight after water to fat mass. At the last measurement, that estimate was about 1.3 kilograms above the start, while some other outputs drifted over time in both sessions [3].
Can a scale agree on weight and disagree on fat mass?
A hospital study in France compared three commercial smart scales with dual-energy X-ray absorptiometry, or DXA. The researchers had results from roughly 48 to 53 patients per scale. The median differences in body weight were about 0.3 kilograms or less. For fat mass, the median differences were −2.2, −4.4, and −3.7 kilograms. A negative difference meant that the scale estimated less fat mass than DXA for that comparison [2].
For the first scale, the middle half of differences in estimated fat mass ranged from around 5.8 kilograms below DXA to 1.3 kilograms above it. A median below the comparison reading can include individual readings in either direction. That range helps explain why adding back the median difference would not make each measurement agree [2].
Those are study medians for particular scales and groups of patients. They don't supply a correction to apply to someone's own scale. They do show why agreement on weight tells you little about agreement on fat mass. The latter uses a different set of measurements and a model that may vary across devices. Moving to a new scale can change that model even if the two machines agree on weight [2].
The hospital comparison and the drinking experiment also asked different questions. The hospital study looked at the gap between two methods around the same appointment. The drinking study followed how one method's estimate moved over the next hour. You can use them to consider two different possibilities when a reading looks different: what the device is estimating, and what changed before the measurement.
Keep the conditions beside the reading
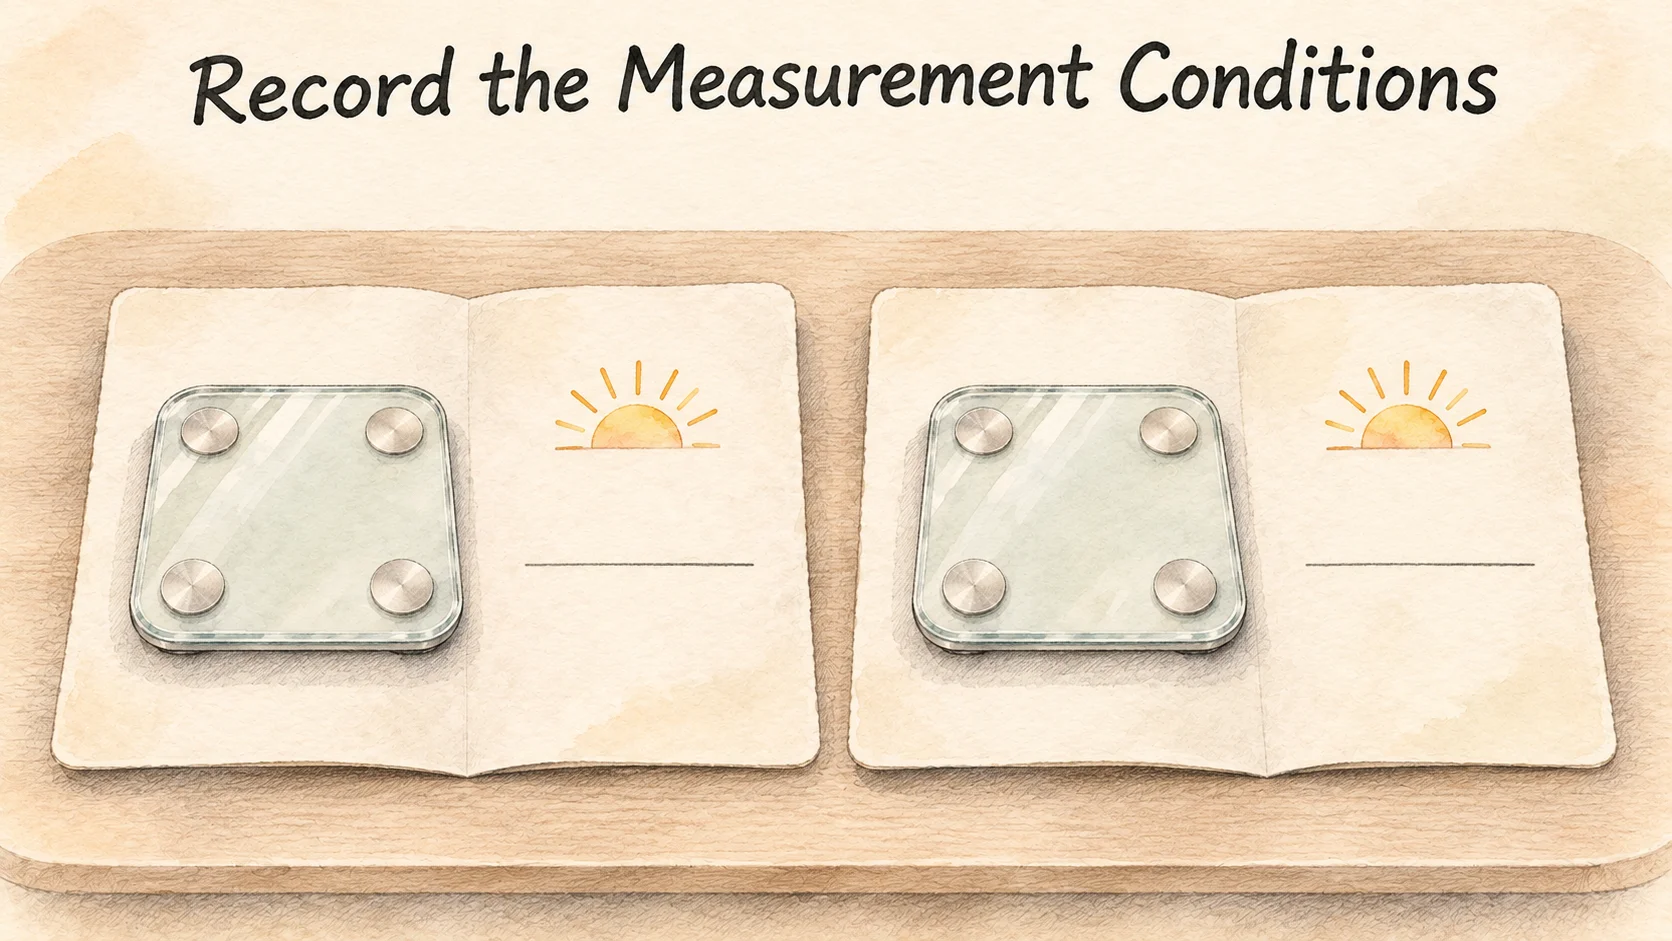
If you want a record you can compare over time, keep the device, date, and time beside the readings. You can add a short note if the measurement was just after eating, exercising, or another departure from your usual routine. Look at readings from the same device under similar conditions together. If you switch devices, marking the date makes it easier to see whether a shift in the numbers started around the same time.
For example, Monday and Wednesday might both be morning readings on the same home scale. Friday might be after an afternoon workout on a scale at the gym. You can keep all three observations and compare the two mornings first. The Friday note tells you which device and conditions it represented.
Back at the bathroom scale, the morning and evening estimates differ by one point. If you also know what happened between readings, you have more to work with than a pair of percentages.
References
[1] Dixon CB, et al. The effect of acute fluid consumption on measures of impedance and percent body fat estimated using segmental bioelectrical impedance analysis. Eur J Clin Nutr. 2009;63(9):1115–1122.
[2] Frija-Masson J, et al. Accuracy of smart scales on weight and body composition: observational study. JMIR Mhealth Uhealth. 2021;9(4):e22487.
[3] Tinsley GM, et al. Influence of acute water ingestion and prolonged standing on raw bioimpedance and subsequent body fluid and composition estimates. J Electr Bioimpedance. 2022;13(1):10–20.