
How Much Do You Move on a Day Without Exercise?
Walking to the bus, cooking dinner, and sitting at a desk all use energy. Three studies show how scientists measure movement outside of workouts.
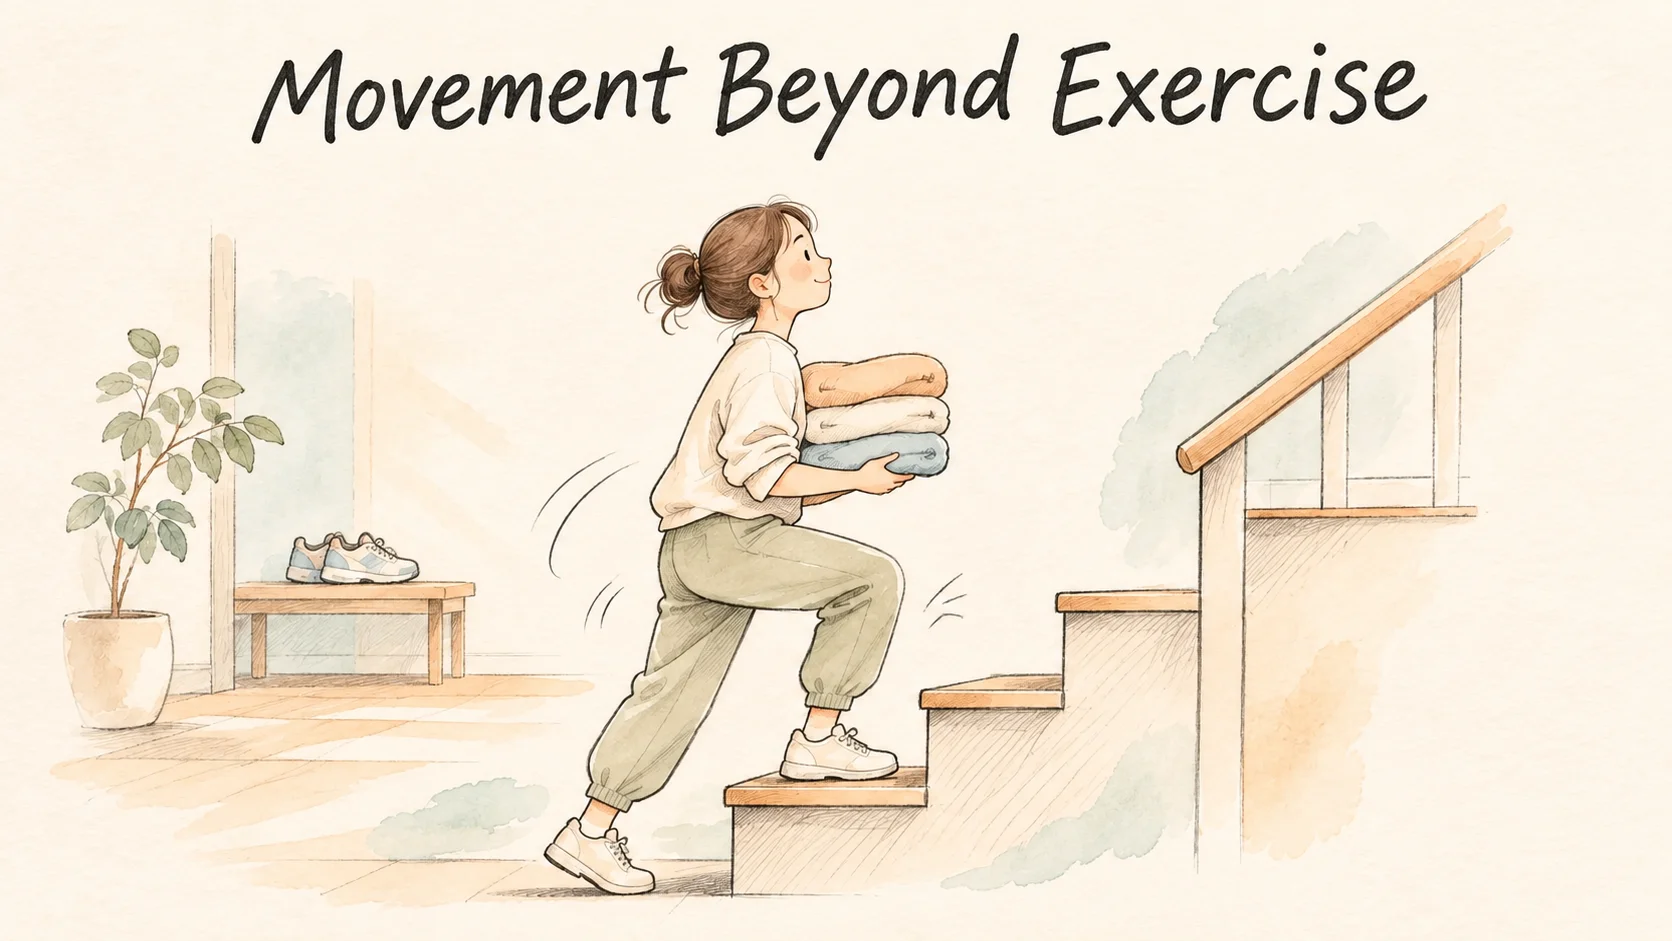
Two people skip their workout. One walks to the bus, takes some papers down the hall at work, and stands in the kitchen chopping vegetables for dinner. The other gets a ride to the office, spends the afternoon in meetings, and orders dinner on the way home. Both exercise logs show a zero. Their bodies have spent the day doing different things.
The Mayo Clinic asked 20 adults with low activity levels to wear sensors for ten days. On average, one group spent 152 more minutes a day standing or moving around than the other. That's about two and a half hours of ordinary life. To understand what that time costs in energy, you also have to know what people were doing during it [1].
▌Which everyday movements use energy?
Even at your desk, your heart is beating, you're breathing, and your body is maintaining its temperature. When you get up, walk to the kitchen, and lift a pot out of a cupboard, your legs and arms have more work to do. Researchers count the extra energy for daily activities above resting expenditure as nonexercise activity thermogenesis, or NEAT. Walking to lunch, standing to wash dishes, and shifting in your chair all contribute. Planned training and the energy the body uses to process food go in separate categories [1, 3].
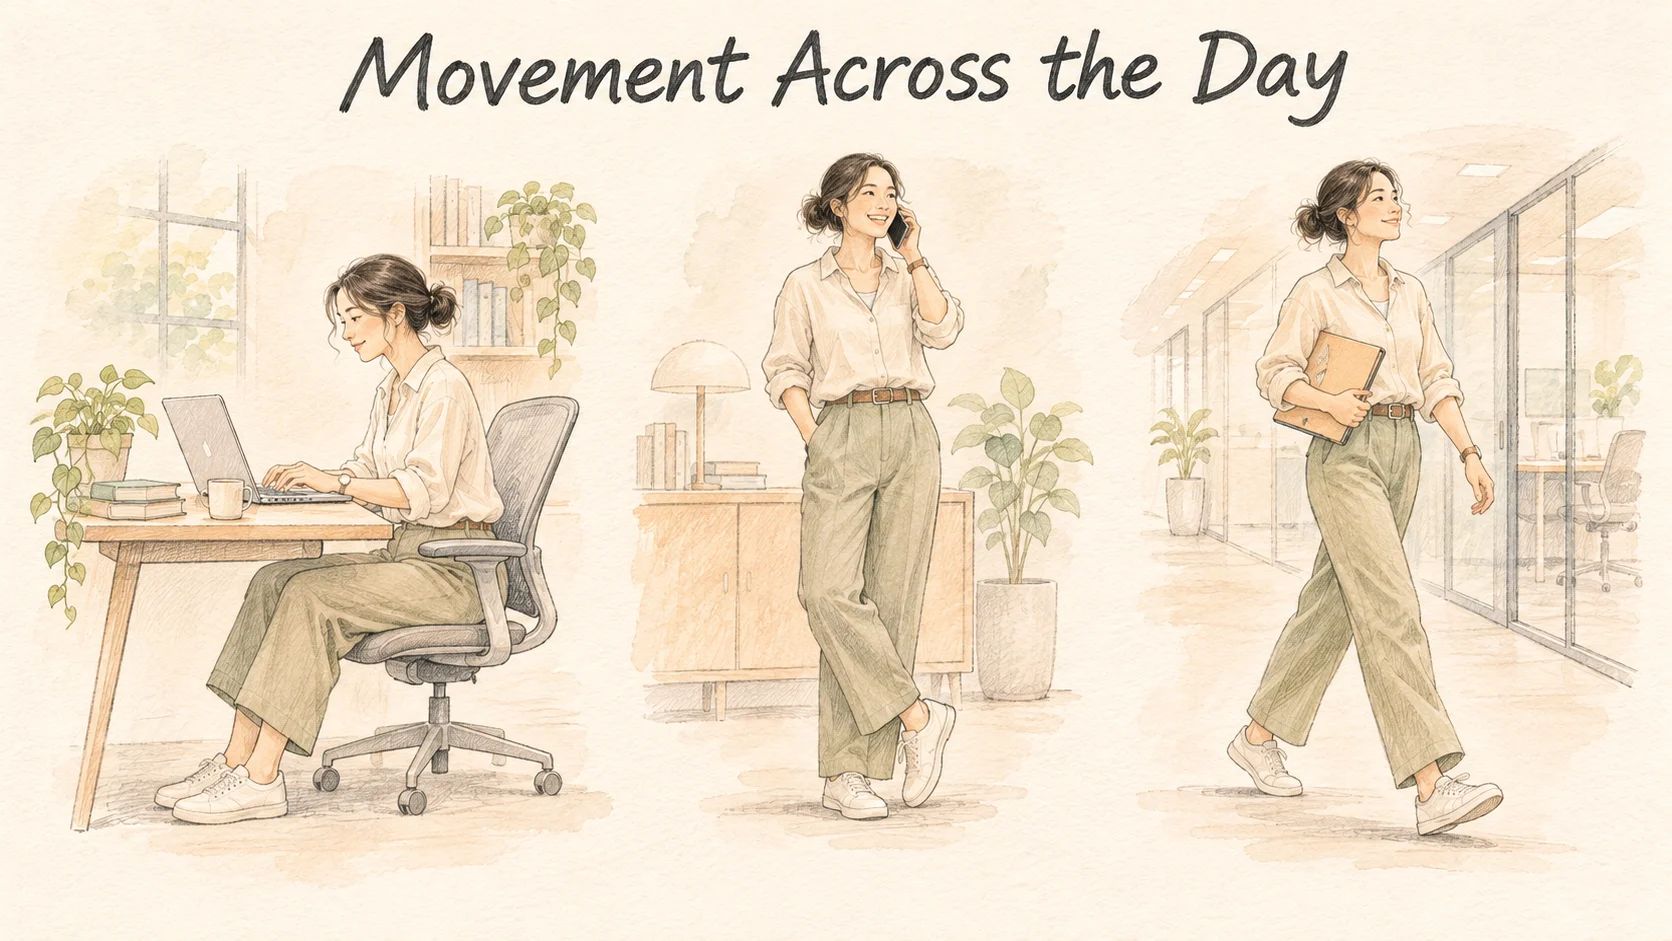
Think of five minutes standing by a door and five minutes carrying groceries upstairs. The time away from a chair is the same, and the muscles have very different jobs. Now imagine walking the same corridor once on Monday and back and forth several times on Tuesday. Each trip is similar, but the total time walking has changed. Studies of daily movement often try to separate those two questions. How much energy does the activity take, and how long do you spend doing it?
▌Where did the extra two and a half hours come from?
The Mayo team recruited ten lean adults and ten adults with mild obesity who all described themselves as sedentary. They kept to their usual schedules and activities. For ten days, wearable sensors captured their posture and movement every half second. The lean group spent an average of 152 minutes more upright or moving around each day. The other group spent 164 minutes more sitting. The two groups slept for nearly the same amount of time [1].
The researchers estimated that if the second group took on the first group's full pattern of movement, they might use about 350 extra calories a day. The estimate combines walking and standing and considers how much of the day was spent doing each. It came from a comparison of existing routines. When you see the 350-calorie figure, look at which parts of the day the calculation is replacing [1].
For example, one person might be on their feet after work because they stop for groceries and unpack them back at home. Another might spend those same minutes waiting at a station. Both are out of their chairs. Put the kinds of activity and their duration next to each other over ten days, and it becomes easier to see how the schedules differ. The study compared twenty people's schedules, a small slice of the ways everyday time can be spent.
▌The first five minutes of standing can look different from the next five
At Switzerland's University of Fribourg, 22 young adults with a BMI in the normal range rested sitting and then stood naturally for ten minutes. The researchers used a ventilated hood to measure respiratory gases. The oxygen a participant used and the carbon dioxide they breathed out let the team estimate energy expenditure minute by minute [2].
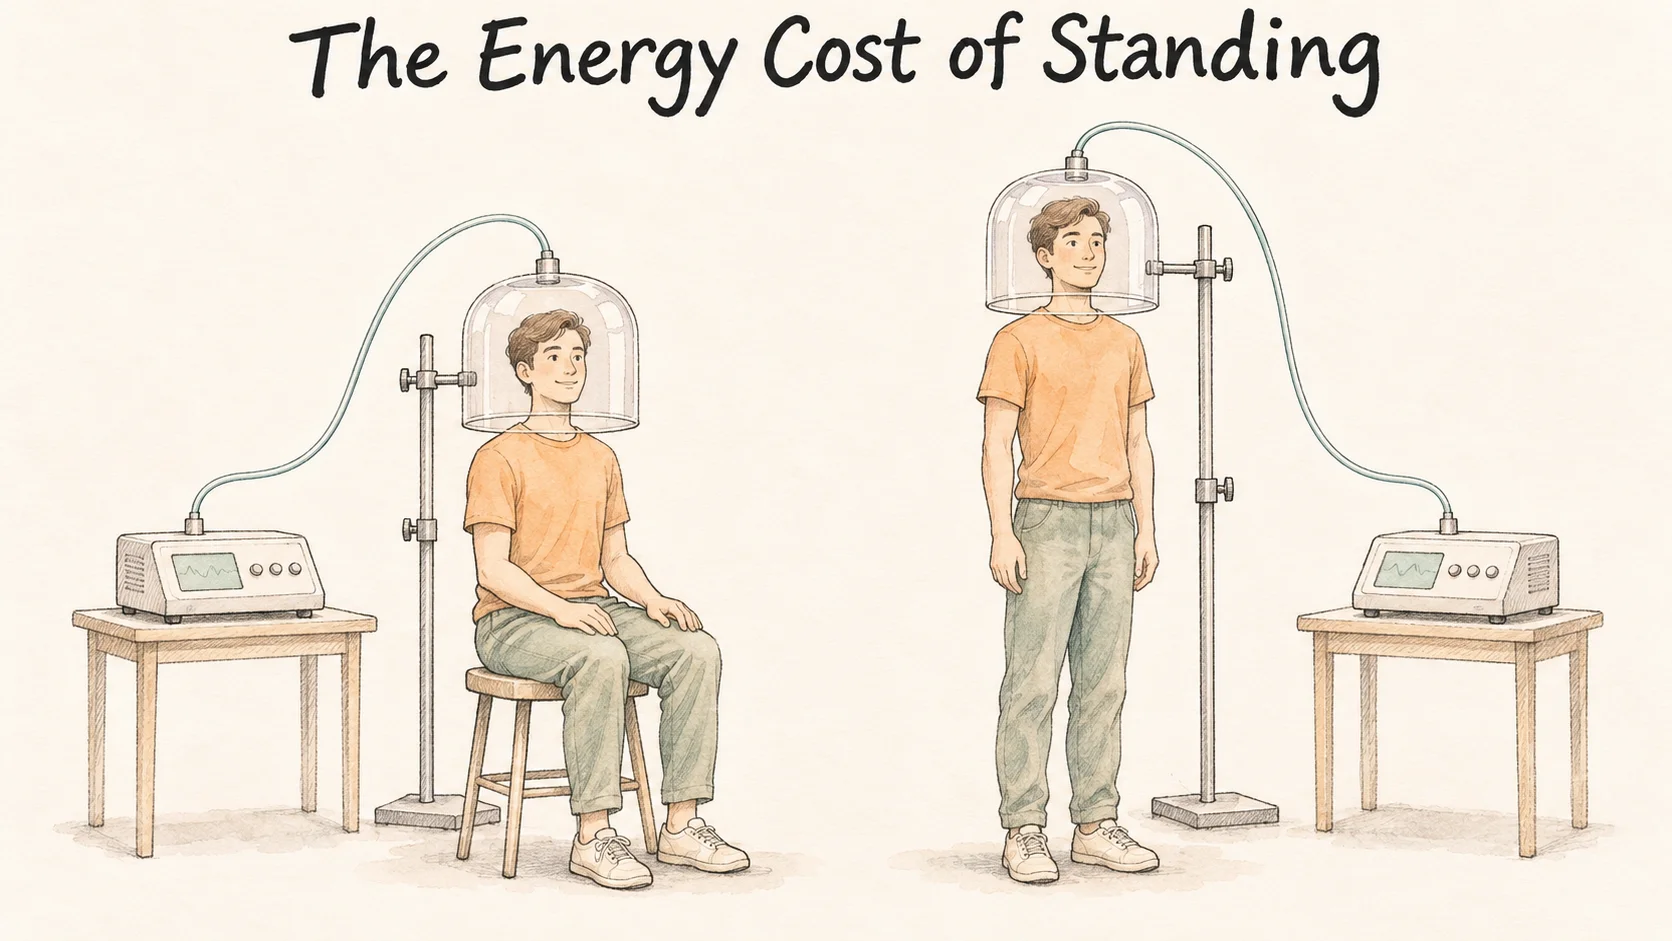
For eight participants, standing changed their energy expenditure by less than five percent compared with sitting. For the other fourteen, it initially rose by seven to twenty-one percent. Ten of those fourteen returned close to their seated expenditure in the second half. Four continued to use more energy. A reading from the opening minutes would capture the rise while missing what happened next [2].
Those percentages are relative to each person's seated expenditure. Say someone uses 1.2 calories a minute sitting. An increase of ten percent would be 0.12 additional calories for that minute. The example shows what the percentage is describing. The study's readings changed during ten minutes of quiet standing, so to understand a different stretch of time you still need to know what the person did in it.
▌Why was the athletes' number bigger and their share smaller?
At Waseda University in Japan, 21 male varsity athletes and 12 male students who didn't train wore accelerometers at their waists for a week. They also wrote down what they did. The logs marked out warm-ups, team practice, and games. The devices helped researchers estimate how much energy the other activities used above a resting baseline [3].
| Daily averages in the study | Athletes | Non-athletes |
|---|---|---|
| Energy from daily movement (NEAT) | 821 kcal | 643 kcal |
| Total energy expenditure | 3,491 kcal | 2,210 kcal |
| Share from daily movement | 23.4% | 28.8% |
The athletes averaged 178 more calories of daily movement. Their overall expenditure was larger by an even wider margin. That total includes the energy for resting, processing food, everyday movement, and workouts. With a bigger whole day to divide by, a bigger calorie number still made up a smaller share [3].
The athletes actually spent fewer minutes in the part of the day classified as daily activity, about 790 versus 949. That window includes time awake and sitting, as well as more vigorous movements. The athletes spent more time on vigorous activity within that window. Counting the minutes alone would miss how differently the two groups used them [3].
The athletes also weighed an average of 78.1 kilograms, compared with 61.6 kilograms for the other group. Expressed per kilogram of body weight, their daily NEAT estimates were 10.5 and 10.4 calories, a difference that wasn't statistically significant. When you see this kind of table, check whether the number is an amount, a share of the day, or an estimate per kilogram. Here, the numbers describe male students at one university during the week they wore the devices [3].
▌Compare two ordinary days from your own week

Choose two workdays with a similar schedule. In a note on your phone, jot down a couple of things you did in the morning, afternoon, and evening. Notice when you walked, stood to do a task, or stayed in your seat for a long stretch. An entry like “walked ten minutes after getting off the bus” or “sat through a two-hour meeting” gives you a duration as well as an activity.
Put the two days side by side and look for the time of day when they started to differ. Maybe you collected a parcel and bought groceries on one day, then spent most of the next evening on the couch. The next time you're curious about your routine, look at that same part of the day again. You'll have a route or a stretch of sitting to compare, even on a day when the workout log is empty.
References
[1] Levine JA, et al. Interindividual variation in posture allocation: possible role in human obesity. Science. 2005;307(5709):584–586.
[2] Miles-Chan JL, et al. Heterogeneity in the energy cost of posture maintenance during standing relative to sitting. PLoS One. 2013;8(5):e65827.
[3] Goshozono M, et al. Characteristics of non-exercise activity thermogenesis in male collegiate athletes under real-life conditions. Front Sports Act Living. 2024;6:1326890.