
What Do Triglycerides Measure, and Why Can They Change After a Meal?
A triglyceride result measures a concentration at the time blood was drawn. Follow how fat travels in the blood and how researchers compared results taken at different times after eating.
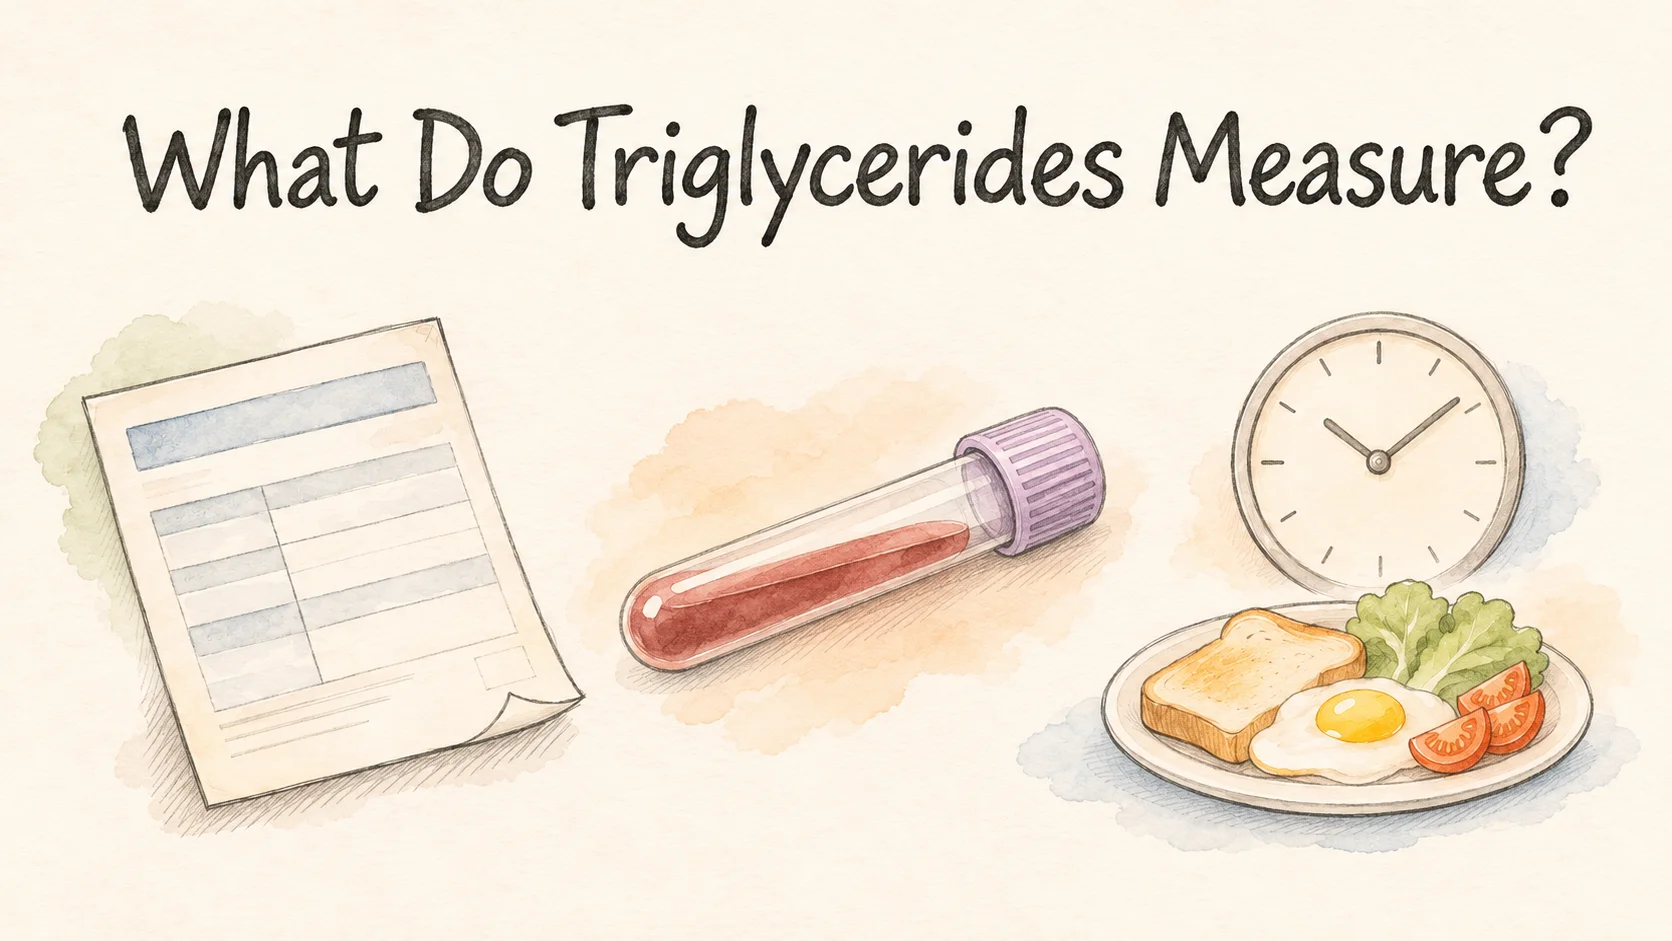
Your last blood test was before breakfast. This time, you ate before leaving home. The triglyceride result is higher. It measures the concentration of triglycerides in the blood sample at the time of the draw. After a meal, the intestine starts sending absorbed fat into circulation. At the same time, tissues can take some of that fat up. The amount you measure depends in part on when you look [1].
A Danish study of more than 33,000 people found that the largest difference in average triglycerides between groups who had eaten recently and those who had been fasting was about 27 mg/dL. That was a comparison across different people. It helps explain why the timing belongs beside the number on the report [2].
How does a triglyceride make it into the blood?
A triglyceride contains one glycerol molecule attached to three fatty acids. When you eat food containing fat, digestion breaks the fat down. The intestine absorbs the pieces and puts some of them back together. Since fat doesn't readily mix into watery blood, the intestine packages it in lipoprotein particles. The larger intestinal carriers are called chylomicrons. They travel through lymph before they enter the bloodstream [1].
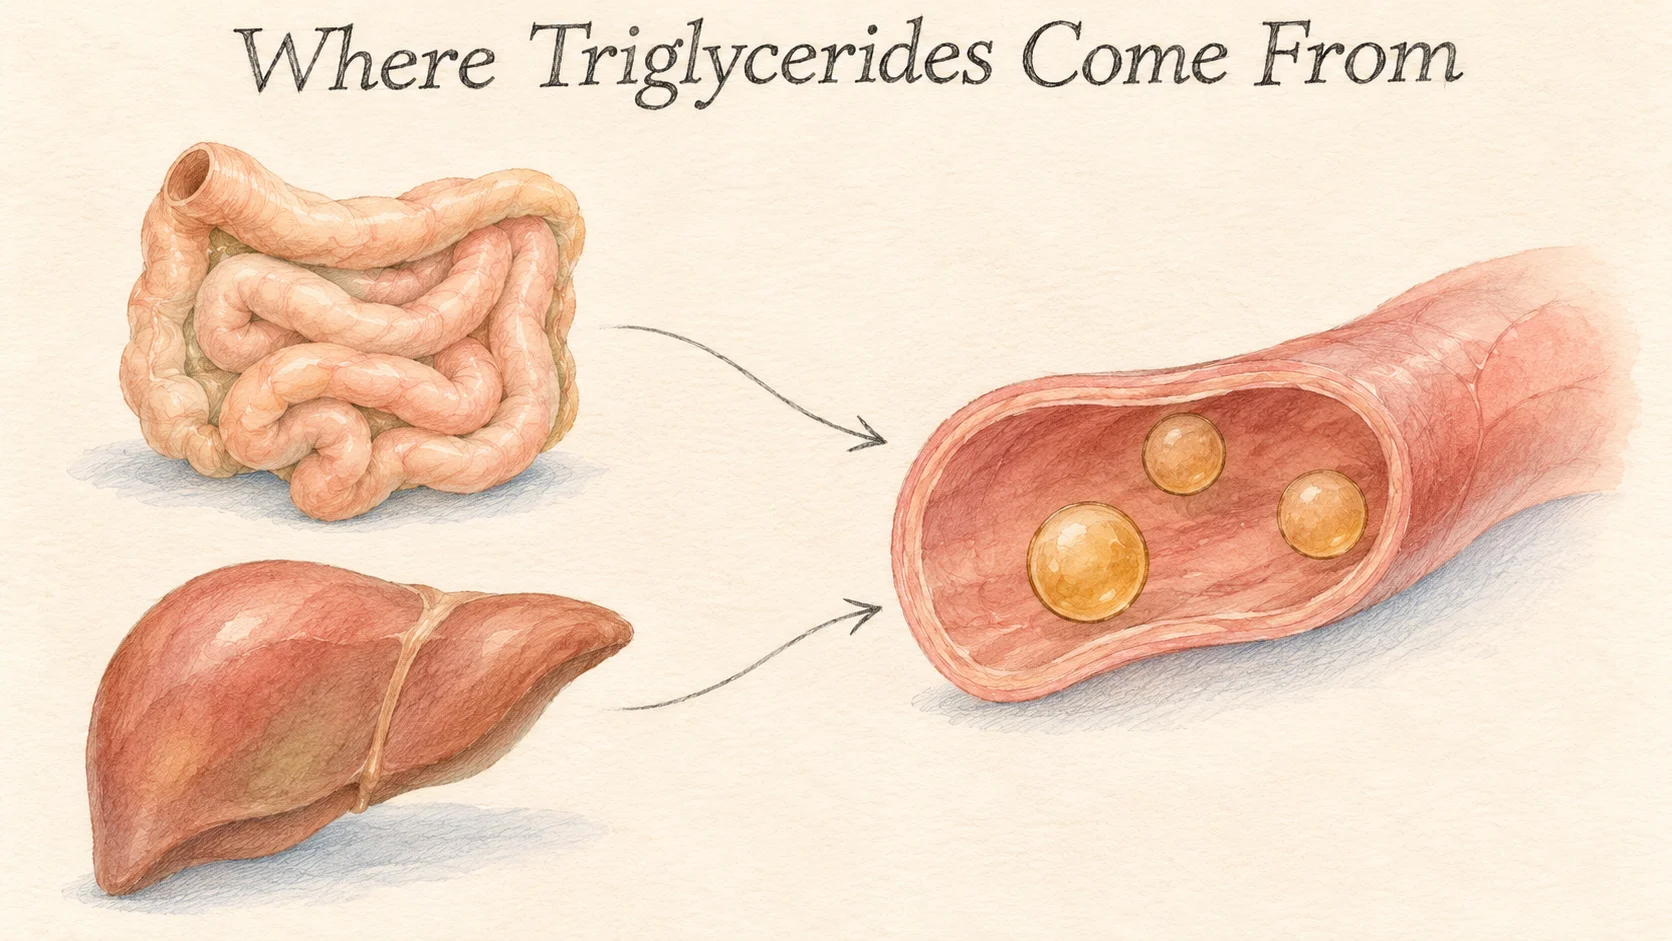
The liver sends triglycerides into circulation as well. It packages them in particles known as very-low-density lipoprotein, or VLDL. That route keeps working between meals. Tissues such as muscle can use the fatty acids released from triglycerides in those particles, while fat tissue can take them up for storage. The concentration in a sample reflects how much triglyceride is in circulation at the moment, while delivery and uptake are both taking place [1].
The unit mg/dL tells you how many milligrams are present in 100 milliliters of the liquid portion of the blood sample analyzed by the lab. A food label gives you the grams of fat in a portion. The amount of body fat you carry is a third measurement. Each looks at a different place and uses a different denominator. A vial of blood gives a concentration in that vial.
How can a researcher tell which route the fat took?
A study in Helsinki followed 15 men whose baseline triglyceride levels varied. They ate a standardized high-fat breakfast with 69 grams of fat. The researchers used stable isotopes as identifiable tracers and collected blood at multiple time points. They separated the particles in the samples by density and looked for those tracers. That combination helped them distinguish particles released by the intestine from those released by the liver [1].
The 69 grams describe the amount of fat in the whole test meal. The tracers were distinct substances the researchers could identify in the particles later. Repeated samples let them track those markers as they appeared and cleared. An ordinary lab result uses the total concentration and does not follow individual particles through time [1].
After the meal, the marker of intestinal origin showed up in chylomicrons and in some smaller particles in the VLDL density range. The marker dropped faster in the chylomicrons and more slowly in some of the smaller particles. The result comes from one high-fat test meal with 15 men and describes what the researchers could see with those tracers and their model. It helps explain why a single triglyceride concentration can't be split into separate amounts from the intestine and the liver [1].
It's also a reason to pay attention to the time of the draw. The particles in the bloodstream shortly after eating and several hours later can carry different amounts of triglyceride. The study in Helsinki could watch the process by taking repeated samples from the same person [1].
How different were the readings after ordinary meals?
The Copenhagen General Population Study used a different method. Researchers analyzed blood samples from 33,391 people aged 20 to 95. Before the blood draw, they asked each person when they'd last eaten. People who had eaten within one hour went into a different group from people who had eaten two or three hours earlier. Those who had gone at least eight hours since their last meal were the fasting comparison for this study. The researchers also accounted for age and sex when comparing the groups [2].

Average triglycerides were higher in the groups sampled up to six hours after a meal than in the fasting comparison. The largest mean difference, about 0.3 mmol/L, was seen one to four hours after eating. For triglycerides, 1 mmol/L is about 88.6 mg/dL, so 0.3 times 88.6 works out to roughly 27 mg/dL. These are two ways to express the same average difference [2].
Imagine seeing two people who both had blood drawn at nine in the morning. One finished breakfast at seven thirty. The other last ate the previous evening. They have matching appointment times but different times since their last meals. Copenhagen sorted thousands of one-off results according to those intervals. The participants ate their own meals rather than a breakfast prepared by the research team [2].
The sample sizes illustrate the difference in design. There were 8,790 people in the group who had eaten two to three hours before the draw, and 795 in the fasting comparison. They were different people, each contributing a result to a group. The researchers compared group averages. They weren't matching each fasting draw to a later draw from the same person [2].
The group differences up to six hours describe the way the samples were grouped. To know whether a given person's triglycerides had returned to their previous value by then, you would need measurements from that person at both times. The Helsinki researchers repeatedly sampled the same people after one set meal. The Copenhagen team used a bigger sample and captured the range of ordinary meals people happened to eat [1, 2].
Put the two test results next to their sampling times
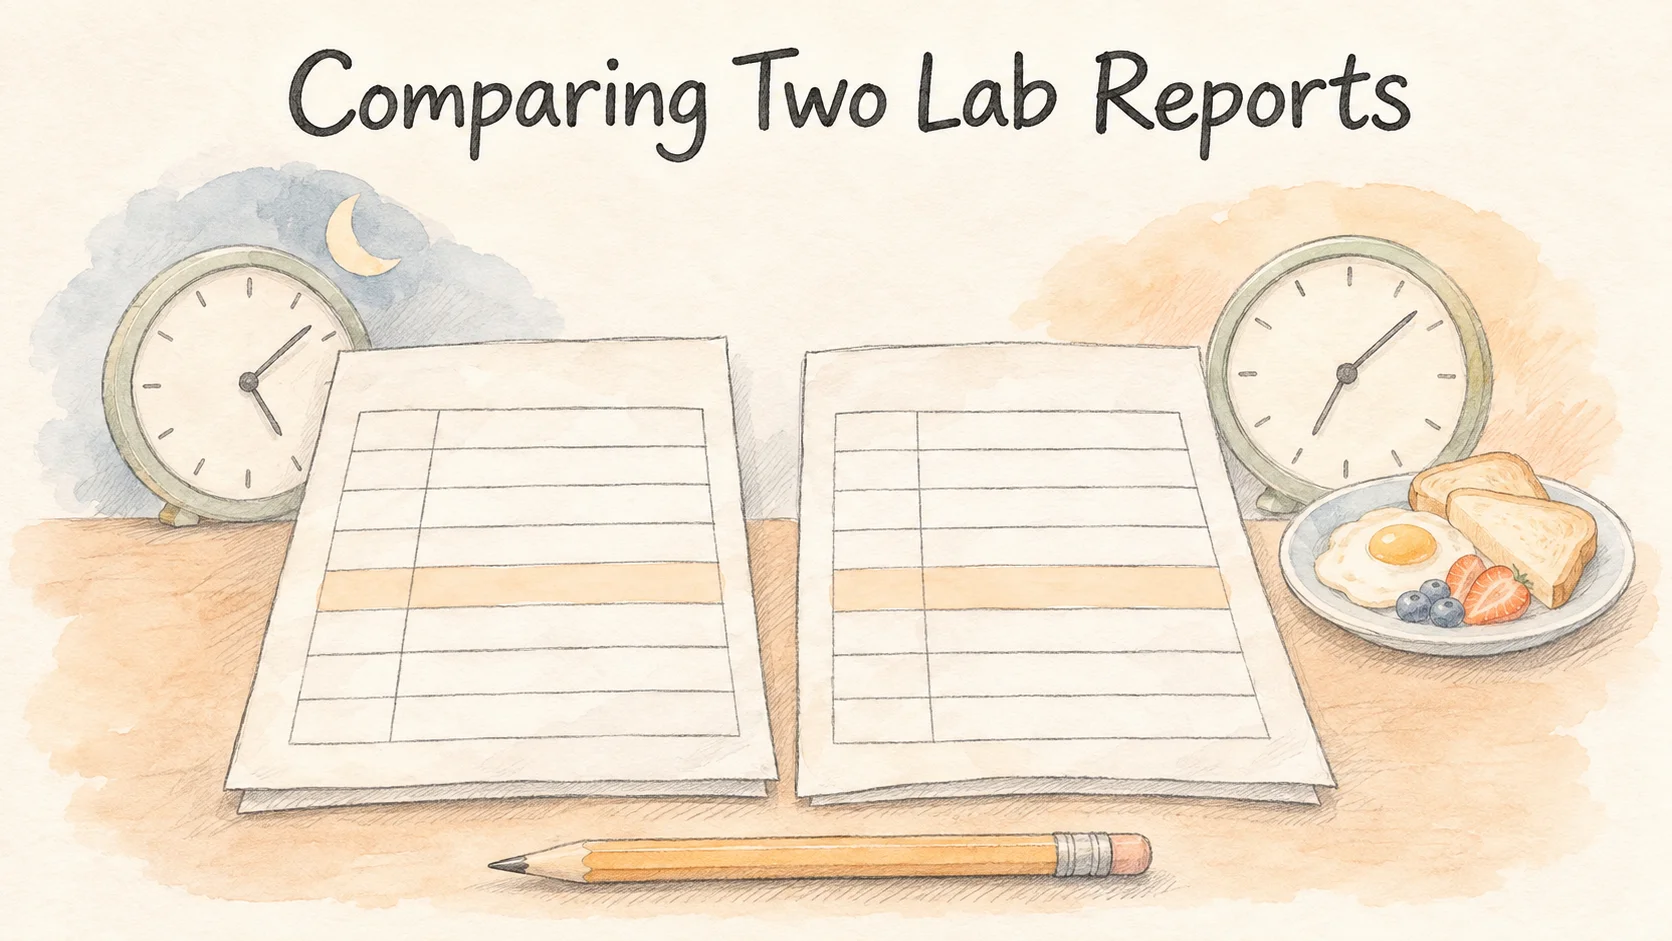
Write down the triglyceride value, its unit, the blood draw time, and the time of your previous meal for each report. Say the first draw was at eight thirty in the morning after an eight o'clock dinner the night before. The second was at ten after a seven thirty breakfast. If the results were 108 and 135 mg/dL, the difference would be 27 mg/dL. Those are made-up figures. The Copenhagen average can't be subtracted from that second report to reconstruct a person's fasting value.
If one lab uses mmol/L and another uses mg/dL, keep the original unit with each value. You can add a separate column with a converted value to compare them. The size of the number on the page alone can't tell you which concentration was higher. First check that the units describe the same thing.
If your report lists the draw time but you can't remember your last meal, leave that part blank. You'll still be able to match the units and see which sampling details you know. The next time you compare two results, you'll have more to work with than the number on its own.
References
[1] Björnson E, et al. Apolipoprotein B48 metabolism in chylomicrons and very low-density lipoproteins and its role in triglyceride transport. J Intern Med. 2020;288(4):422–438.
[2] Langsted A, et al. Fasting and nonfasting lipid levels: influence of normal food intake on lipids, lipoproteins, apolipoproteins, and cardiovascular risk prediction. Circulation. 2008;118(20):2047–2056.