
What Does the HDL Cholesterol Line on Your Lab Report Measure?
HDL-C records how much cholesterol HDL particles carry. Two studies show how that differs from a test of HDL function and from cardiovascular events.
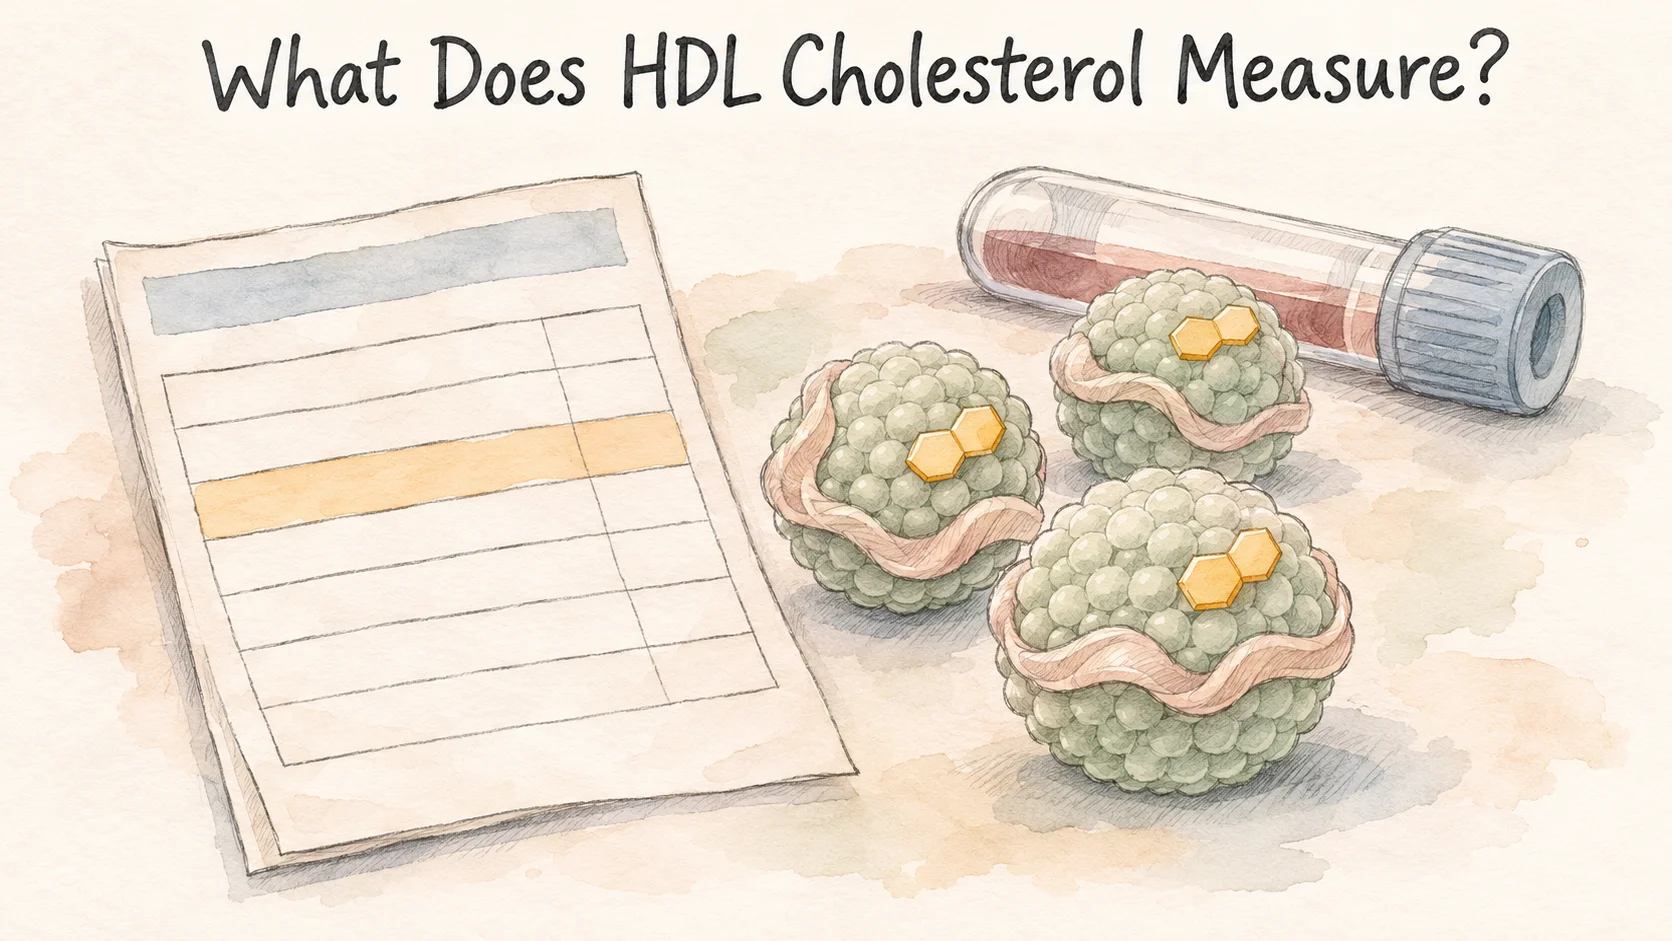
You're looking at a lab report and remember hearing HDL called “good cholesterol.” What went into the number? HDL-C measures the concentration of cholesterol carried by high-density lipoproteins. It tells you how much cholesterol that category of particles was carrying in the sample. To see how well particles take cholesterol away from cells, researchers use a different test [1].
In a Dallas study of 2,924 adults, researchers measured both the cholesterol concentration and one part of that transport function. Then they followed people over time. With both kinds of data on the table, they could compare what each measure told them [1].
Lipid panels often put total cholesterol, triglycerides, HDL-C, and LDL-C within a few lines of one another. The names look similar, and several fields may share a unit. Read the HDL-C line aloud as “cholesterol carried by HDL per volume of this sample.” The short phrase gives you a carrier, a cargo, and an amount measured in the sample.
HDL-C and LDL-C refer to cholesterol in different carriers
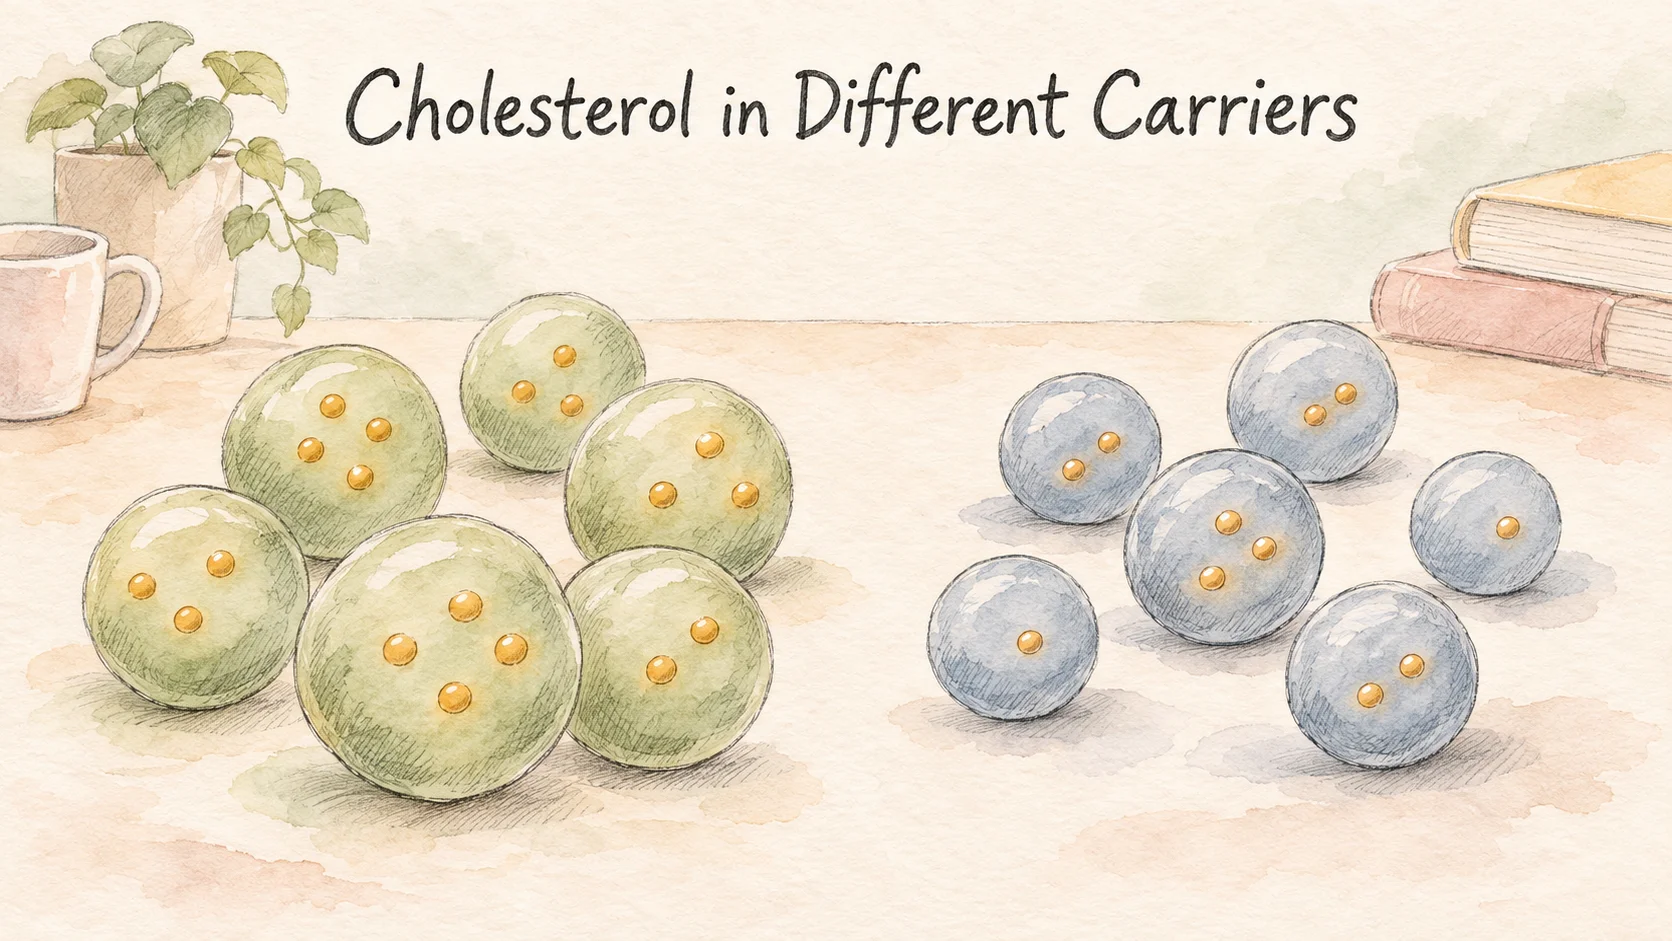
Cholesterol travels in blood with the help of particles called lipoproteins. HDL stands for high-density lipoprotein, and LDL stands for low-density lipoprotein. The C means cholesterol. Each line describes how much cholesterol is in one category of those particles. Both can be given in mg/dL, or milligrams in 100 milliliters of the sample [1, 2].
Suppose two reports give HDL-C readings of 45 and 55 mg/dL. The second has 10 milligrams more cholesterol in HDL per deciliter of sample. There can be different numbers of particles in the samples, and individual particles can carry different amounts. Finding more cholesterol doesn't by itself tell you whether more particles are present or how they work. You'd need another measurement for each of those questions [1].
HDL takes part in moving cholesterol away from tissues through pathways that can bring it back to the liver. The number on the report is the amount present at that moment. Think of weighing what a group of vehicles is carrying once. It doesn't tell you how many trips they made before you looked.
Two samples could even have the same HDL-C and distribute the cargo differently. One might contain more HDL particles, with each carrying a smaller amount of cholesterol. The other might contain fewer particles carrying more cholesterol each. HDL-C alone leaves that distribution open. A particle concentration and an assay of how much cholesterol passes from cells to a sample each require a measurement of their own [1].
How do researchers measure the transfer out of cells?
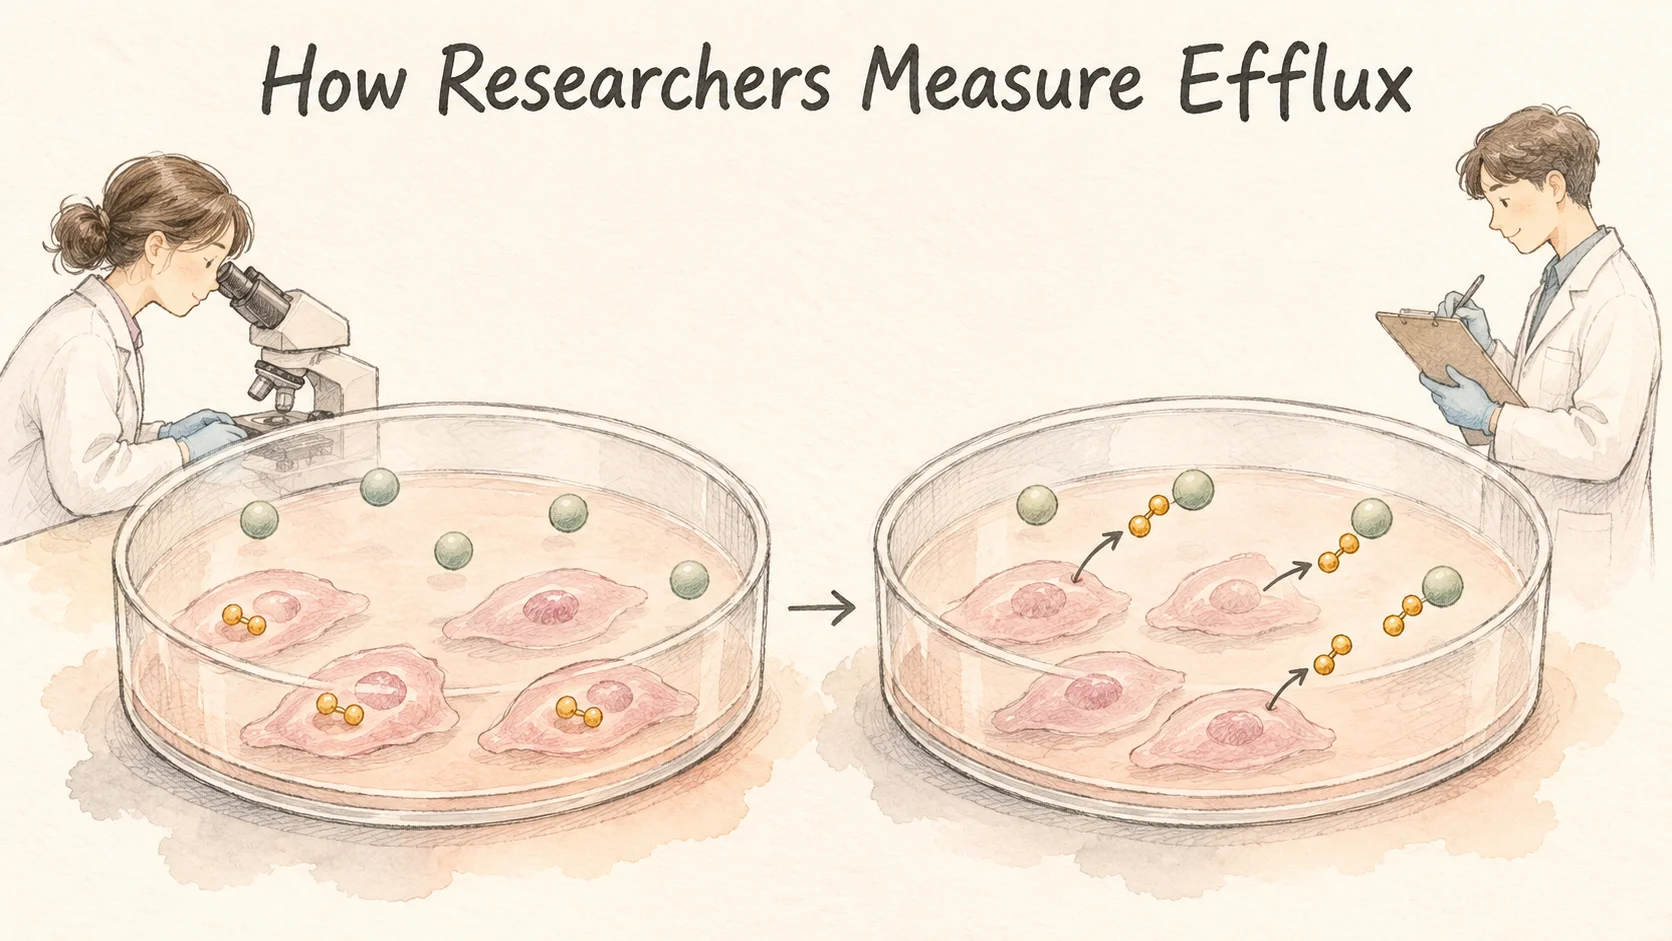
The Dallas researchers used a test called cholesterol efflux capacity. They loaded cultured cells with fluorescently labeled cholesterol. They processed plasma from each participant to remove certain other particles, then exposed the cells to what remained. They measured how much labeled cholesterol moved out of the cells under those laboratory conditions. The test captures one step in the movement of cholesterol, using cells in a lab dish [1].
The participants had no cardiovascular disease at enrollment. The study measured HDL-C, the concentration of HDL particles, and efflux capacity. The median follow-up was 9.4 years. Researchers divided the efflux values into four groups and compared the highest and lowest quarters. The estimated hazard ratio for cardiovascular events was 0.33 after accounting for other factors in the model, including HDL-C and particle concentration [1].
This was a study of how results across a group related to events later on. An association across those groups doesn't tell us what would happen if you changed that one measure in the same person. It does show why the efflux test and the cholesterol concentration are different measurements. If your report lists just HDL-C, it does not include a separate cell-based test.
The 95% confidence interval around that hazard ratio was 0.19 to 0.55. A hazard ratio compares the rate at which events occur during follow-up between the groups. A value of 0.33 does not say that 33% of the participants had an event. The group that had the lower rate was also defined by the separate lab measurement of efflux, rather than by the HDL-C line available on a routine panel [1].
Do events fall when HDL-C goes up?
A trial called AIM-HIGH asked a question about changing blood lipids during treatment. It enrolled 3,414 adults who already had atherosclerotic cardiovascular disease and were receiving lipid-lowering treatment. It randomly assigned them to add a niacin formulation or a placebo. After two years, median HDL-C in the niacin group rose from 35 to 42 mg/dL. Other lipid readings changed as well [2].
The researchers counted cardiovascular events specified in advance, including several kinds of events in a combined outcome. Over approximately three years, that outcome occurred in 16.4% of the niacin group and 16.2% of the placebo group. The difference was not statistically significant. The added treatment raised HDL-C in this setting, and the trial did not detect fewer events. That finding comes from this particular treatment comparison in adults already receiving care [2].
The outcomes also use different units. The change in HDL-C is a change in milligrams per deciliter. The percentages count people in each group who experienced the combined outcome. You can put both results in the same paragraph, but you cannot turn one into the other by converting units.
The two studies ask questions with different starting points. In Dallas the researchers measured a trait and observed what happened next. In AIM-HIGH they used random assignment to test what happened when they added an extended-release form of niacin to existing statin-based therapy. The trial stopped early after an assessment showed that continuing was unlikely to demonstrate a benefit on its main outcome. The answer belongs to that intervention and those participants [1, 2].
Put the AIM-HIGH results on separate lines and the difference becomes easier to read. A move from 35 to 42 mg/dL gives a seven-point change in the reported median concentration in one group. The event percentages compare two groups over time. The treatment also changed other lipid measures, so the trial cannot separate out a move in HDL-C on its own. It can compare what happened after this particular intervention was added [2].
Keep the name and unit with the number

When you keep a record of a lipid panel, write HDL-C, LDL-C, and triglycerides on separate lines, with their date and units. If both cholesterol values are listed in mg/dL, compare each line with its earlier counterpart. One describes how much cholesterol was in HDL and the other describes how much was in LDL. An article may go further and report a functional assay or events over several years. Look at which result it actually counted before comparing it with your lab report.
A copy of a journal article can be marked up the same way as a copy of a lab panel. Mark values reported in mg/dL with the name of the substance and carrier. For a culture-dish result, mark the source of the sample and the measured transfer. For an event result, write down what counted as an event and when the researchers counted it. The small labels make it much easier to return to the result later.
References
[1] Rohatgi A, et al. HDL cholesterol efflux capacity and incident cardiovascular events. N Engl J Med. 2014;371:2383–2393.
[2] AIM-HIGH Investigators. Niacin in patients with low HDL cholesterol levels receiving intensive statin therapy. N Engl J Med. 2011;365:2255–2267.