
LDL Cholesterol and ApoB: What Do the Two Tests Measure?
The same amount of cholesterol can travel in different numbers of particles. A study of nearly 300,000 adults shows what the two lab results can tell you.
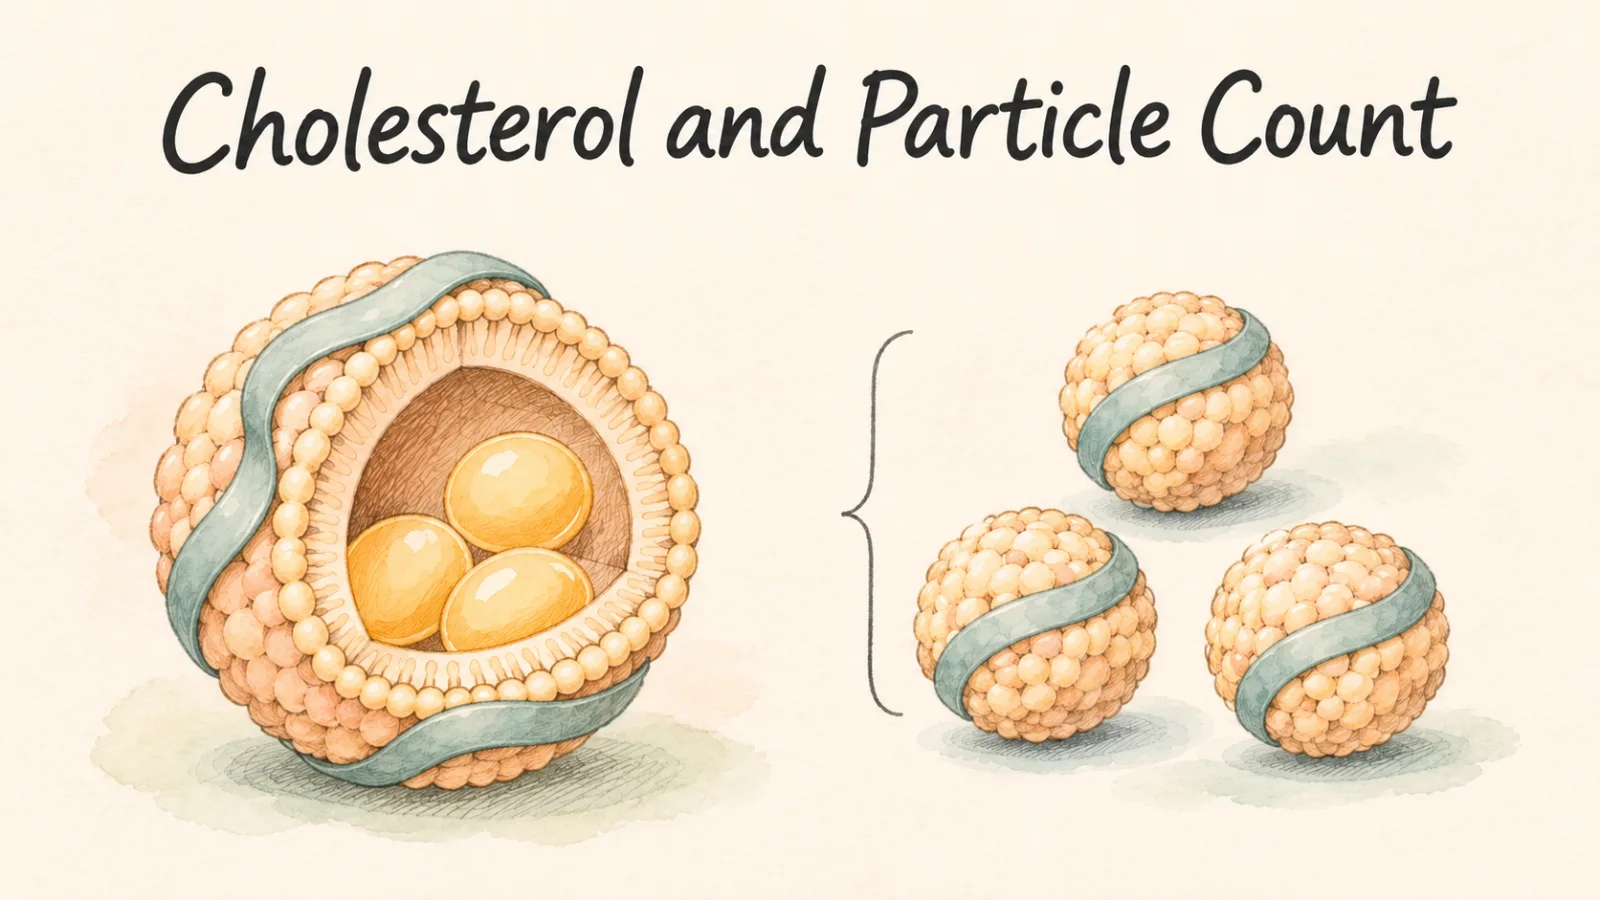
You open your blood test results and find LDL-C next to a number in mg/dL. A few lines down, apoB appears in the same unit. If both results are in milligrams per deciliter, what does the second line add?
LDL-C tells you how much cholesterol LDL particles carry in a given volume of blood. ApoB measures a protein whose concentration helps estimate how many particles carry it. The amount of cholesterol in each LDL particle can vary. Two people with similar LDL-C can therefore have different apoB results [1][2].
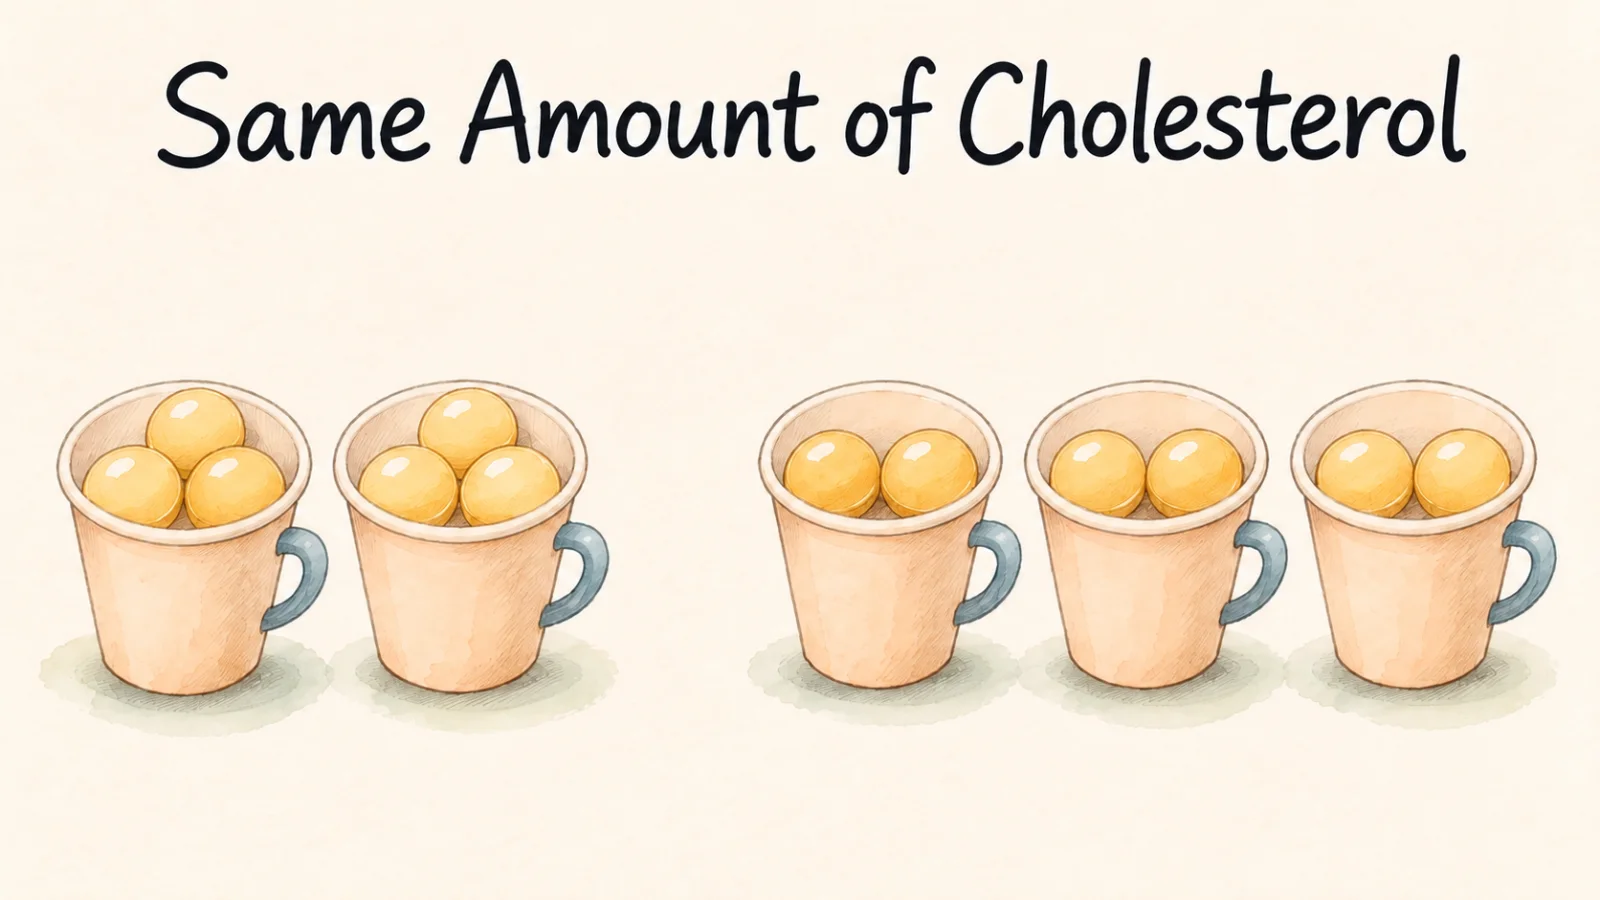
The same six beads can fill two cups or three
Cholesterol travels in the blood inside small packages made of fats and proteins called lipoproteins. LDL is one class of lipoprotein. The C in LDL-C stands for cholesterol, so that line in the report refers to the amount of cholesterol carried by LDL. Milligrams per deciliter tells you that the laboratory expresses the result as mass per volume of blood [1][2].
Picture six identical beads on a table. Put three beads in each of two cups, then imagine distributing the same six beads across three cups, two in each. A scale would give you the same weight if you tipped out the beads on either side. Counting the cups gives you two on one side and three on the other.
Now look at the handles. Each cup has one handle, no matter how many beads you put in it. On a real LDL particle, a protein called apoB100 wraps around much of the outside. Researchers used cryo-electron microscopy to resolve its structure on human LDL. Each LDL particle carries one copy, which is what makes apoB useful for estimating particle numbers [1][2].
The example starts with identical cups to make one difference easy to see. In blood, several kinds of particles carry apoB. LDL has it, and so do VLDL, IDL and lipoprotein(a). The apoB test reflects these particles together. Think of a shelf that has several styles of cups, each with a handle. A count based on the handles can represent the whole shelf, while weighing the beads from one kind of cup answers a narrower question [1][2].
This also explains why a lab report gives apoB in mg/dL. The lab measures how much of the protein is present in a given volume. The connection between the protein and the number of particles comes from the structure of those particles. Reading the unit alone will tell you how the result is expressed. Reading the name tells you what was measured [1][2].
The results usually move together. How much can they differ?
Researchers analyzed results from 293,876 UK Biobank participants aged 40 to 73 who were free of known cardiovascular disease at the start. The median follow-up was 11 years. Across the study population, LDL-C and apoB had a correlation of 0.96. Put one dot per person on a plot of the two results, and people with higher LDL-C would generally fall higher on the apoB scale as well [2].
Then the researchers narrowed their view to a band of people whose LDL-C was 120 to 140 mg/dL. They took a group whose apoB was at least one standard deviation above the average for that band and a group whose apoB was at least one standard deviation below it. A standard deviation describes how spread out the measurements are. People near the middle of the apoB distribution were outside this particular comparison [2].

The estimated 10-year rate of atherosclerotic cardiovascular events was 7.3% in the higher-apoB group and 4.0% in the lower-apoB group. Put those percentages on a scale of 100 people and the difference looks like about seven versus four. The subtraction gives 3.3 percentage points. The researchers estimated those rates from follow-up records using a statistical method that accounts for different follow-up times [2].
Two different time spans. Eleven years was the median time participants were followed. Ten years was the common point in time at which the researchers compared the two groups' estimated rates [2].
What if your own LDL-C result says 130 mg/dL? The comparison left out many people whose apoB fell closer to the average. Even within the two selected groups, the percentages describe the people in the study together. The study followed participants whose results were already different at the start, and their other circumstances could differ too. An assessment of an individual's risk needs more information than the LDL-C number and the two rates shown here [2].
Some reports add a line called non-HDL cholesterol. It takes the cholesterol in HDL away from total cholesterol, leaving cholesterol carried by the other particles. Think of setting one kind of cup aside and weighing the beads in all the remaining cups. That broadens what gets included compared with LDL-C while keeping the substance being measured the same. ApoB is a different kind of measurement because the laboratory is looking at the protein [2].
Comparing two reports starts with the name of the test
When you put two reports side by side, start with the test names, then check the units and dates. LDL-C in mg/dL tells you the concentration of cholesterol carried by LDL. ApoB in mg/dL gives the concentration of the protein. If you subtract one from the other, the result is like subtracting the weight of the cup handles from the weight of the beads. The arithmetic is easy. The two measurements describe different things [1][2].

Say your old report includes LDL-C and the new one includes both LDL-C and apoB. Find the LDL-C result on both pages and put them in date order. For apoB, the newer result is the first entry you have. If the label or unit is written differently on the two reports, keeping the original wording alongside the numbers will help you check that the two entries belong on the same line.
You might also see two similar LDL-C results and wonder whether the number of particles that carry apoB stayed about the same. If you have apoB results on both dates, there is a separate line to compare. If either result is missing, filling it in from the LDL-C number would assume the very relationship you're trying to check. The UK Biobank comparison shows how much a similar LDL-C can leave open about apoB [2].
What if you divide LDL-C by apoB to work out how much cholesterol the average LDL particle carries? That would work with the toy cups if you weighed the beads from one set of cups and counted the handles on that same set. With the two blood test results, the cholesterol comes from LDL while the protein comes from multiple kinds of particles. To make that calculation for LDL, you would need a particle count for the same set of particles whose cholesterol you measured [1][2].
The next time you open your results, try writing a few words beside each line. Next to LDL-C, write “cholesterol carried by LDL.” Next to apoB, write “estimate of the number of particles carrying apoB.” Put the reports in date order, and the question behind each value travels with it.
References
[1] Berndsen ZT, Cassidy CK. The structure of apolipoprotein B100 from human low-density lipoprotein. Nature. 2025;638:836–843.
[2] Sniderman AD, et al. Discordance among apoB, non–high-density lipoprotein cholesterol, and triglycerides: implications for cardiovascular prevention. Eur Heart J. 2024;45(27):2410–2418.