
How Can One A1C Test Reflect Several Months of Blood Glucose?
Some glucose binds to hemoglobin in red blood cells. See what A1C measures, why recent weeks count more, and how it relates to estimated average glucose.
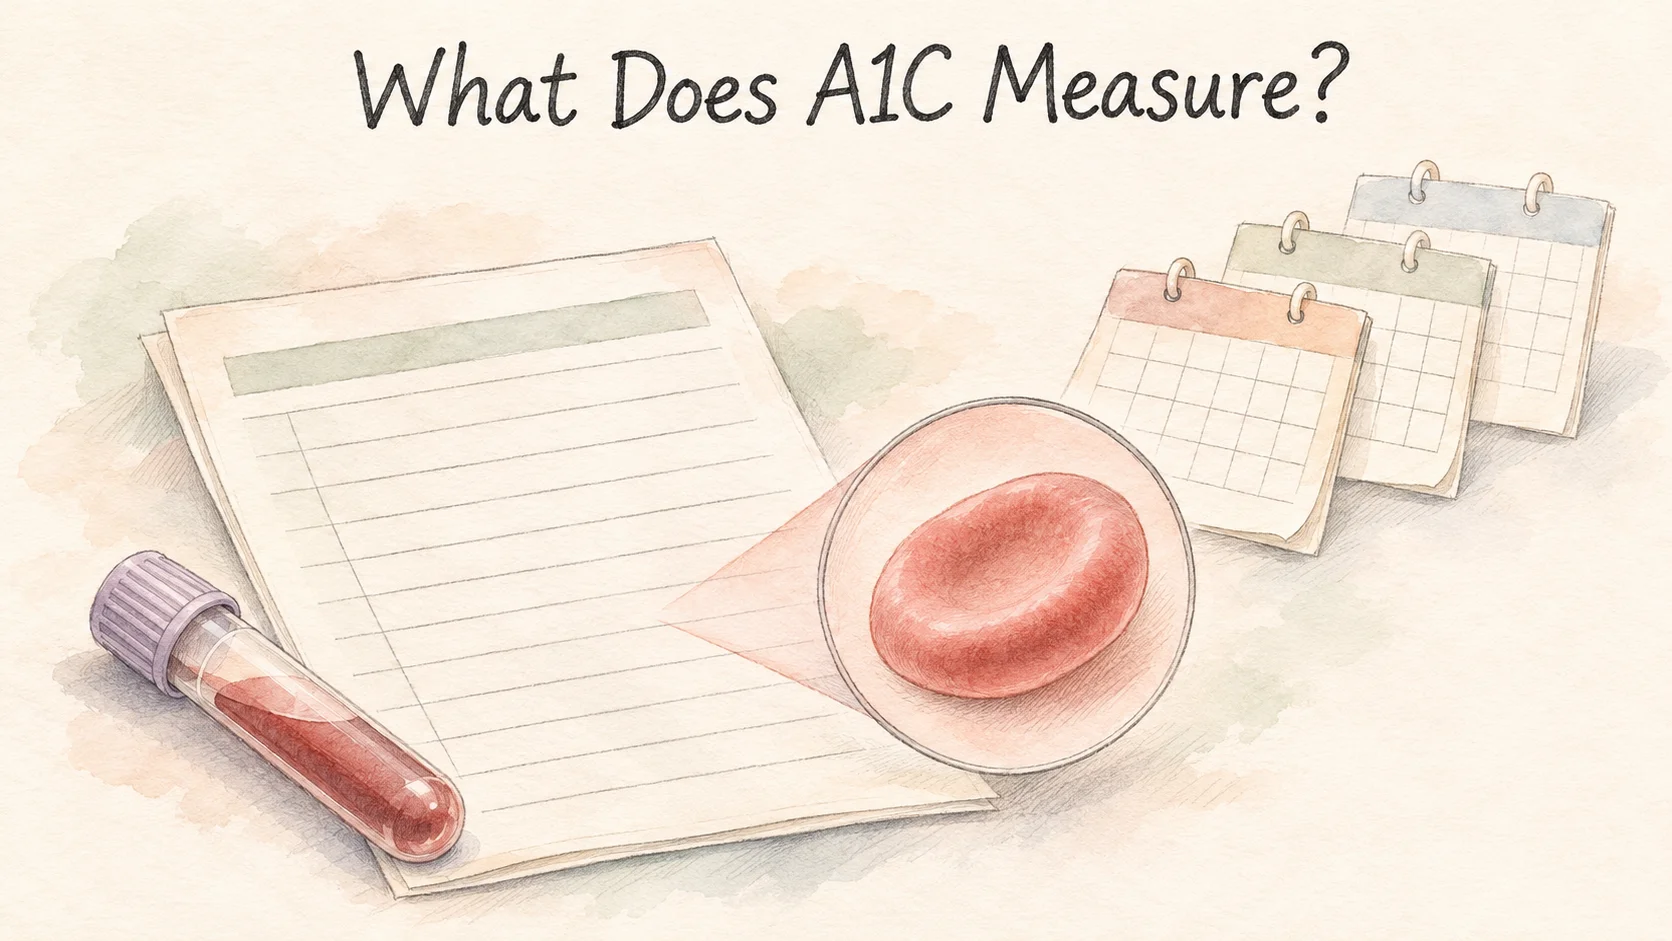
Your lab report has a line for fasting glucose and another for A1C. The blood may have been drawn on the same day, but the two results cover different spans of time. A glucose result tells you how much glucose was present when the sample was taken. An A1C test measures a proportion of hemoglobin that has glucose attached. That proportion reflects glucose exposure over roughly the past three months, with recent weeks tending to have more influence [1, 3].
That longer record comes from the red blood cells in the sample. Their ages and the amount of glucose they encountered while in circulation help determine the result.
How does glucose get attached to hemoglobin?
Red blood cells contain hemoglobin, the protein that carries oxygen. Some glucose reacts with hemoglobin and becomes attached to it. That process is called glycation. Higher glucose concentrations generally make the reaction more likely. Once a molecule is attached in this way, it remains with the cell's hemoglobin until that cell is replaced [3].

When a report gives A1C as a percentage, it is expressing a proportion of glycated hemoglobin. Fasting glucose commonly appears in mg/dL, which describes the concentration of glucose in the sample. An A1C of 7% and a glucose concentration of 154 mg/dL use different units because they come from different measurements. The relationship between the numbers comes from research comparing them across people [2, 3].
A red blood cell contains many hemoglobin molecules. A result of seven percent is a proportion of the hemoglobin measured in the sample. The lab is not sorting each red cell into a pile of cells with glucose and a pile of cells without it. It is also measuring a different phenomenon from free glucose in the liquid portion of blood [3].
Why do the most recent weeks matter more?
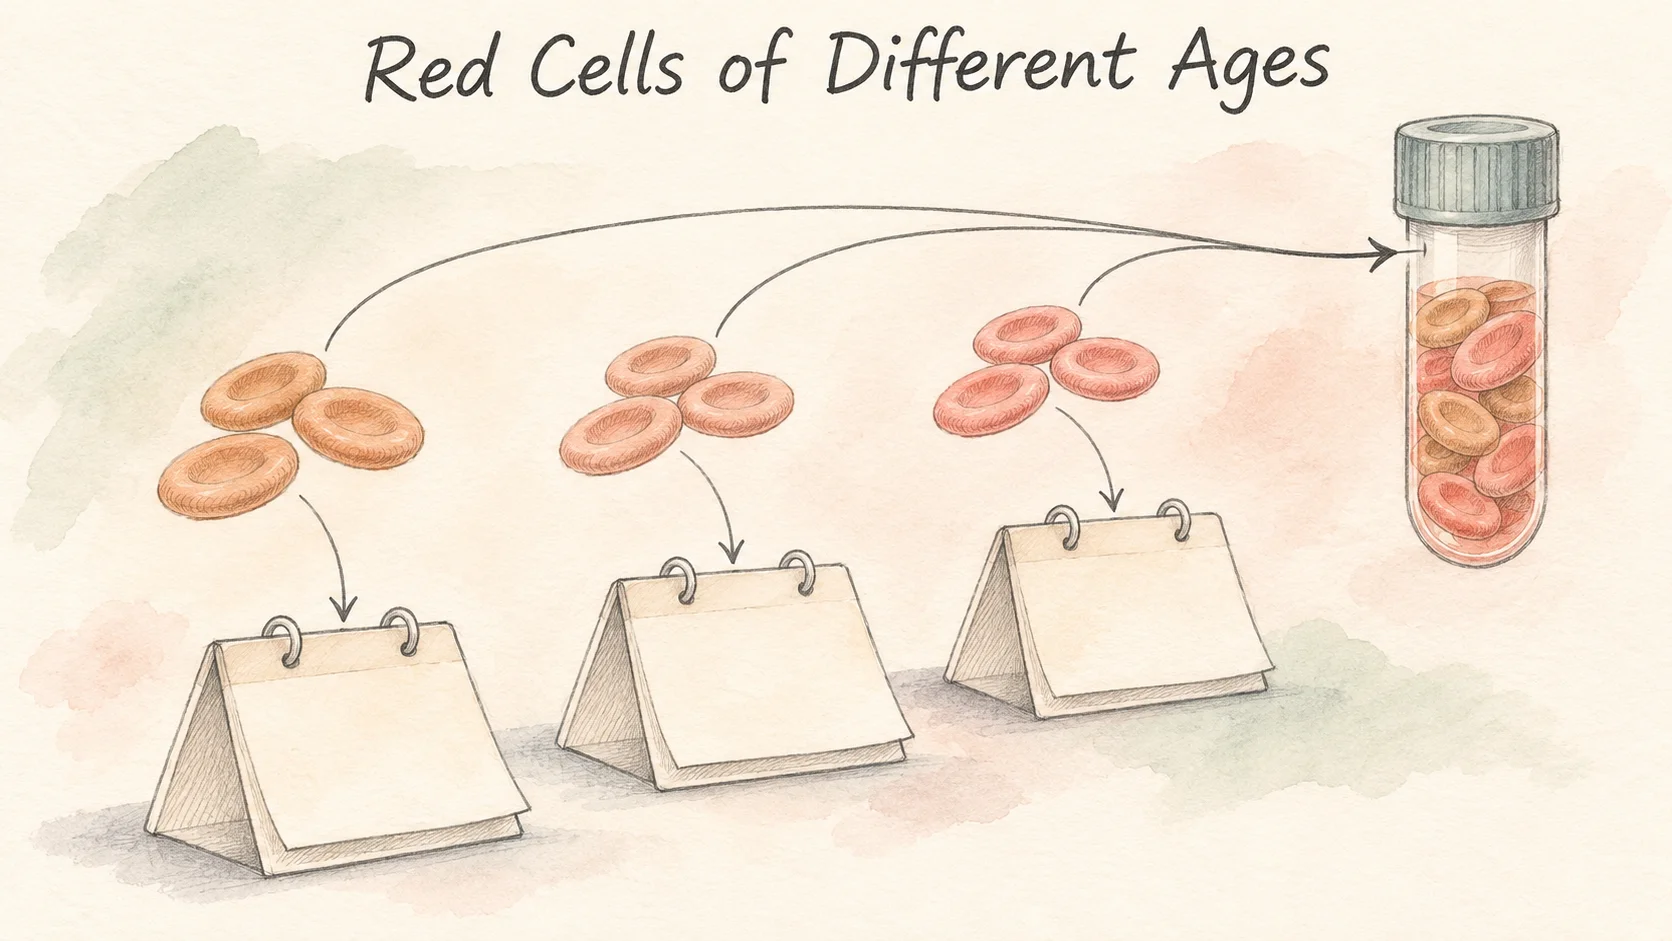
Your body is continuously making red blood cells and removing older ones. A blood sample contains a mix of cells that entered circulation recently and cells that have been there for much longer. On any given day several months ago, only the older cells in today's sample were there. In the last few days, both older and newer cells were exposed to glucose. More cells can therefore carry a record of that recent stretch [1, 3].
A small 1995 study followed nine patients newly diagnosed with type 2 diabetes whose blood glucose fell quickly after hospital admission. The researchers compared the way different glycated proteins responded. Their model estimated that A1C reflected exposure going back about 100 days, with more recent days having more influence. That shape was an estimate based on those patients' results. Think of three months as the approximate scale of the measurement, with no single date when earlier glucose exposure is suddenly erased [1].
In that study, fasting glucose came down fairly quickly. A1C changed over the following weeks. Both can be tested from blood at different visits, and they change at different speeds. A1C needs time to reflect the changes across the red cells in circulation. The timing in those nine patients illustrates the pattern, with no fixed timetable for everyone [1].
The mix of cell ages also explains why two tests can describe partly overlapping periods. If someone has another test four weeks later, some of the cells in the new sample arrived during those weeks. Others were already in circulation before the first test. Both reports have their own recent stretch and share part of the earlier one.
Where does 154 mg/dL come from when A1C is 7%?
The A1C-Derived Average Glucose study, or ADAG, analyzed 507 adults with and without diabetes. The team combined periods of continuous glucose monitoring with repeated finger-stick samples taken at home. It measured A1C in a central lab at the end of three months, then compared that result with the glucose average calculated from the preceding months. The glucose data added up to around 2,700 readings per participant [2].
The participants wore the continuous monitors during several periods, rather than during every day of all three months. Home finger-stick readings supplemented those periods. Of the 507 included in the analysis, 268 had type 1 diabetes, 159 had type 2 diabetes, and 80 did not have diabetes. The equation comes from the glucose averages and A1C results in that combined sample [2].
A regression on those data gives an equation for estimated average glucose. Put 7 into it and 28.7 × 7 − 46.7 comes to about 154 mg/dL. The table in the paper gives an accompanying range of about 123 to 185 mg/dL for an A1C of 7%. Two people with the same A1C can have different average glucose levels when you measure them directly [2].
The study also selected people whose glucose was relatively stable over the study period and excluded some conditions that affect red blood cells or testing. If a report says “estimated average glucose,” the estimate is useful for understanding the scale of the A1C result. It cannot reconstruct the readings on particular days. The regression links two kinds of measurement across a group [2].
A single glucose reading and A1C answer different questions

Take two sets of readings that average 130 mg/dL. One set might mostly stay close to 130. The other could reach higher and lower values while ending up at the same average. That's what averaging does. An A1C result gives no time stamp for a high or low, and it can't count short-lived dips. Those details require measurements from the times you're asking about [2, 3].
For a small arithmetic example, 120 and 140 mg/dL average 130, and so do 80 and 180 mg/dL. The first pair is closer together than the second. Put the numbers on a timeline and you can see when they occurred. Average them and that information is gone. The example is only a demonstration of what a summary can and cannot represent.
The cells themselves also matter. Recent blood loss or a transfusion can change the mix and ages of red blood cells in a sample. Some variants of hemoglobin affect particular laboratory methods. If glucose measurements and A1C show very different pictures, the timing of the measurements and any changes affecting red blood cells are both relevant to understanding the result [3].
The name of the average matters, too. If you downloaded a set of actual glucose readings, its average came from those time-stamped measurements. An estimated average printed beside A1C comes from the A1C result and an equation. Writing down the source along with the date makes it easier to compare the same kind of result next time.
The next time you open a report with both results, match each line to the question you have. To see glucose at the time of the blood draw, read the concentration and the conditions recorded for the draw. To compare longer periods, put the A1C results alongside the dates. The lines may be next to each other on the page, even though they cover different amounts of time.
References
[1] Tahara Y, Shima K. Kinetics of HbA1c, glycated albumin, and fructosamine and analysis of their weight functions against preceding plasma glucose level. Diabetes Care. 1995;18(4):440–447.
[2] Nathan DM, et al. Translating the A1C assay into estimated average glucose values. Diabetes Care. 2008;31(8):1473–1478.
[3] National Institute of Diabetes and Digestive and Kidney Diseases. The A1C Test & Diabetes.