
What Does an Oral Glucose Tolerance Test Measure After Two Hours?
A glucose drink makes the starting conditions comparable. Read what the two blood samples capture and what a repeat-testing study found.
At the clinic, someone draws blood, gives you a glucose drink, and tells you when to come back for the next sample. Why does the report keep both numbers? The fasting sample gives a starting concentration. The two-hour sample tells you the concentration at a set time after a fixed amount of glucose. That's the oral glucose tolerance test, or OGTT [1].
The later number is a timed reading. It can be compared with the starting level. During the two hours in between, glucose could have been higher or lower than either reading. The two samples tell you about two moments. To learn the highest level, you would need more measurements along the way.
Why fix the drink and the clock?
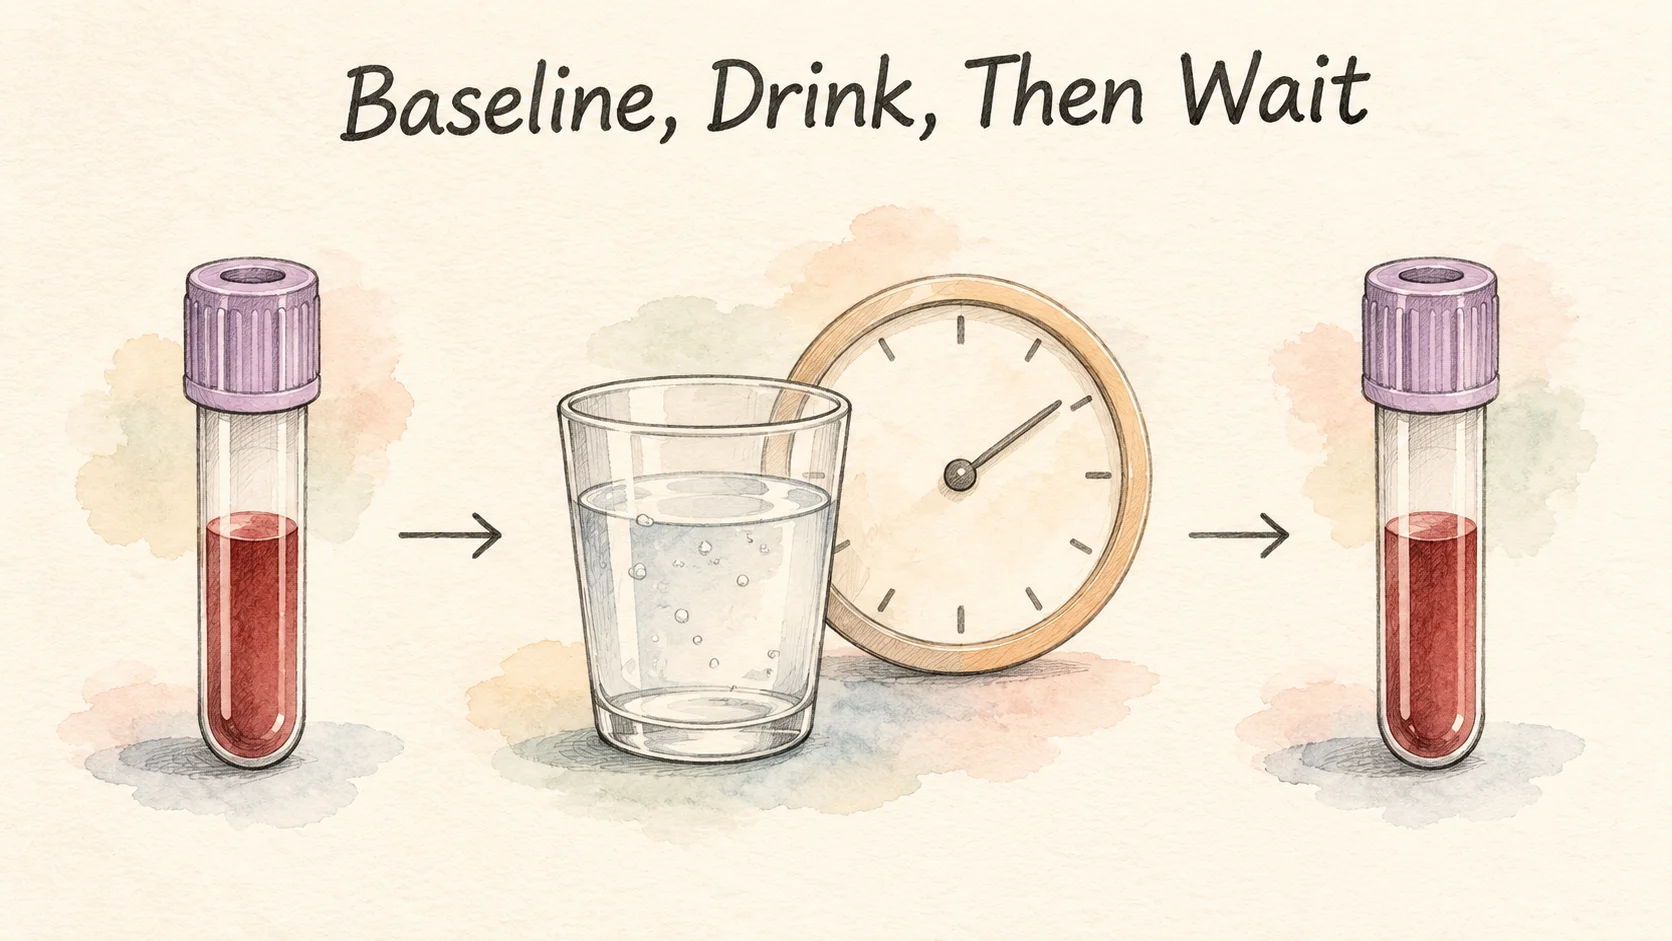
The U.S. National Institute of Diabetes and Digestive and Kidney Diseases describes a standard test for adults outside pregnancy that uses a drink containing the equivalent of 75 grams of anhydrous glucose. Blood is sampled before the drink, after a fast, and again at a scheduled point after taking it, commonly two hours. Other protocols, including tests used in pregnancy, can have different amounts and sample times [1].
Glucose from the drink enters the blood after absorption through the small intestine. Insulin signals influence how tissues take up glucose and how much the liver releases. The two-hour reading reflects all those processes as they played out up to the time of the sample. With the two readings alone, you can't isolate how much came from faster absorption, different insulin secretion, or a change in how tissues used glucose [1, 2].
Fixing the amount helps the people interpreting the test know what went into it. A cup of soy milk and a rice ball for breakfast can vary in size, in composition, and in how quickly you finish. A standard drink and a scheduled sample make a particular comparison possible. A reading after an everyday meal belongs with the details of that meal and the time it was taken.
The first tube also supplies a result that matters in its own right. A fasting value of 90 followed by 125 and a fasting value of 110 followed by 125 share the same ending, but they start at different concentrations. A report keeps those two readings in separate fields. If you reduce it to the size of the rise, you lose the starting value. Keep the units with the numbers, too. The same concentration can be expressed in mg/dL or mmol/L [1].
Can two samples tell you the peak?
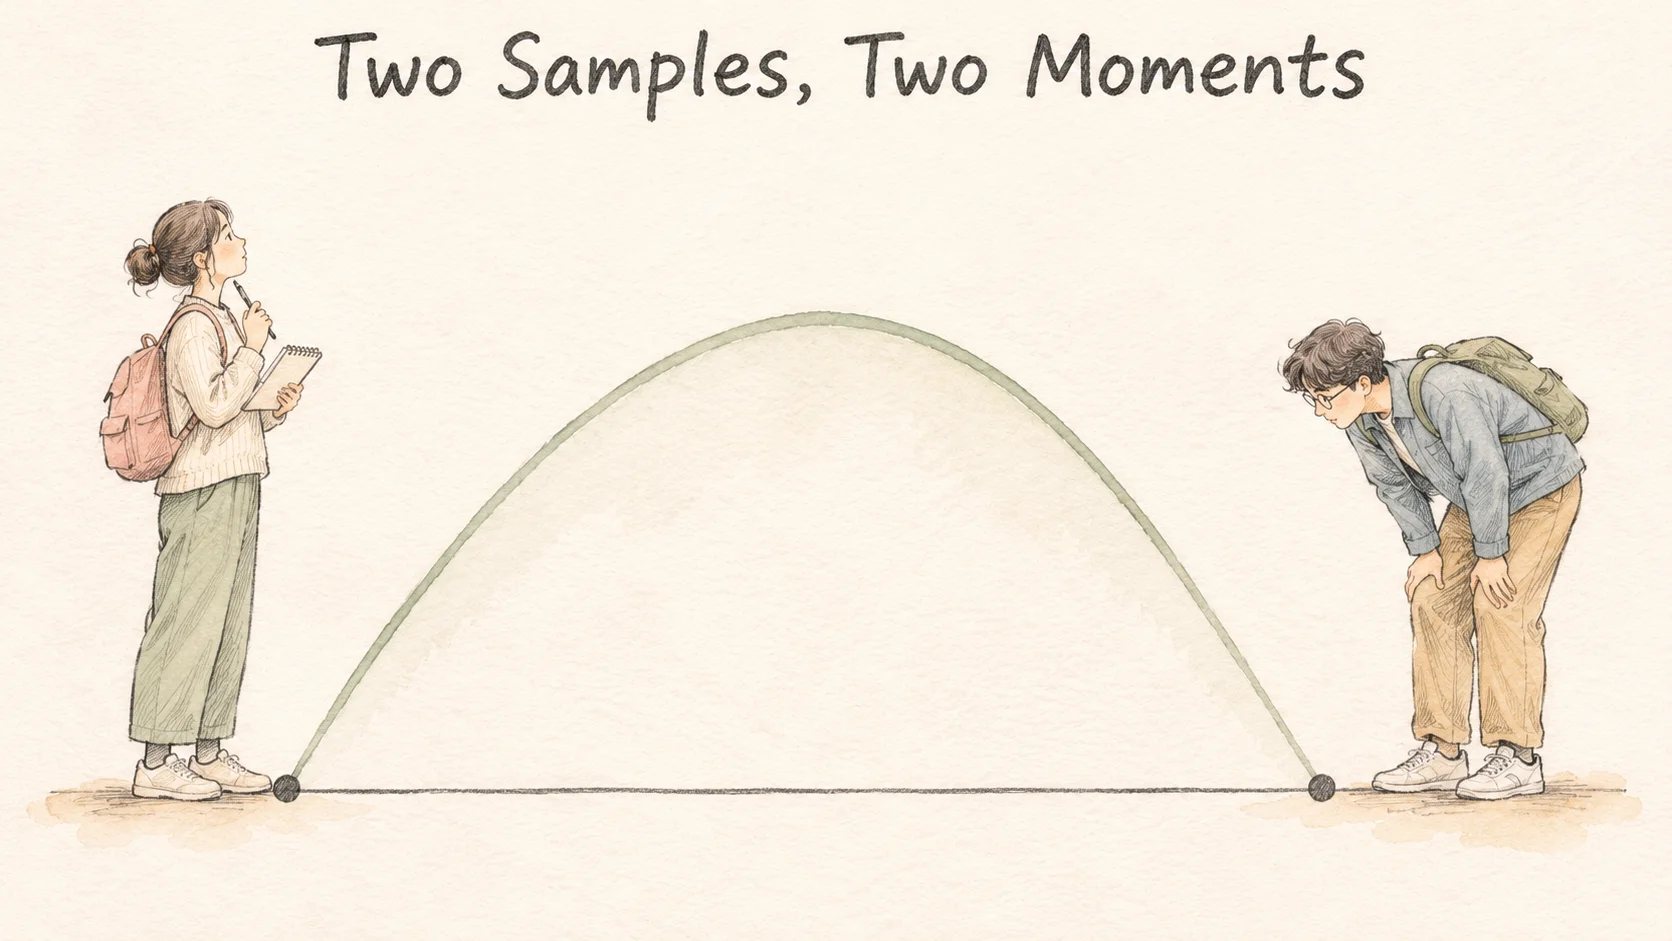
Say a report gives a fasting value of 92 mg/dL and a two-hour value of 128 mg/dL. The second reading is 36 mg/dL higher than the first. That's the difference between two measured times. You still don't know the one-hour value, or the highest level that occurred in between. The numbers in this example show how to read a pair of values.
Picture two people with the same starting and two-hour readings. One person's glucose might rise higher early and then drop faster. Another might take longer to climb and have a gentler rise. Both paths fit the same two points. To compare the paths themselves, a study would have to take samples at additional times.
The same idea applies to a result that ends close to where it started. The readings match at those two moments. That isn't enough to know whether the concentration stayed level throughout the test. It also won't give you the average across other days.
The sample time is a bit like the timestamp on a photograph. Two exposures tell you what was in view twice. They cannot reveal how fast the scene changed in the middle. A study that wants to compare timing can take more snapshots rather than ask two samples to do the work of six. And a result drawn at 60 minutes and one drawn at 120 minutes refer to different parts of the test, even if they are printed in the same units.
If a person repeats a test, which value varies more?
The Hoorn Study in the Netherlands had adults aged 50 to 74 without a history of diabetes take two 75-gram oral glucose tolerance tests. The researchers grouped the participants by what the first test showed. In the 246 people who met the study's normal tolerance definition at that test, they found the difference between each person's two values, then measured how much those differences varied across people [2].
The standard deviation of the paired differences was about 0.4 mmol/L for fasting glucose and 1.3 mmol/L for the two-hour reading. Converted to mg/dL, that's about 7 and 23 mg/dL, respectively. Standard deviation describes the spread of the differences. It doesn't say what any one person's second value will be or give you an amount to add to a new result. In this group, the two-hour differences were more spread out [2].
A standard test means the drink and collecting times have a set protocol. It doesn't make a person's response the same on every occasion. Measurement itself can also vary. To compare two results, start by checking that each result came from the same stage of the test. In the research, the fasting values were paired with fasting values and the two-hour readings were paired with two-hour readings [1, 2].
The Hoorn researchers also reported on 198 people classified as having impaired glucose tolerance on the first test. In that group, the standard deviations of the differences at fasting and two hours were 0.5 and 1.8 mmol/L, respectively. The statistics varied by group even though the researchers calculated them the same way. The researchers estimated that biological variation made up the larger share of the variation they saw. Analytical variation made a smaller contribution. These results tell us something about repeated tests in those groups and supply no fixed correction for an individual result [2].
Keep the sample time with the number

If you're copying an existing report, keep the date, sample time, whether it was fasting or after a glucose drink, and the units. Keep the amount of glucose or the test protocol with the results if it's listed. If the next report just says “glucose,” find the circumstances of that sample. A fasting result, a result after a regular meal, and a result during a timed test can all use the same units.
Back at the clinic, the two numbers give you a starting value and a later value collected under a defined protocol. Keeping the sampling time with each concentration makes it possible to tell which part of the test it describes.
Check the sample description when you return to the record. This article describes the glucose concentration in plasma from a blood draw. Other glucose measurements may use different equipment, sample material, or timing, even if the units look familiar. Writing down the name and sampling method keeps those differences visible when two reports land next to each other.
References
[1] National Institute of Diabetes and Digestive and Kidney Diseases. Diabetes & prediabetes tests: oral glucose tolerance test.
[2] Mooy JM, et al. Intra-individual variation of glucose, specific insulin and proinsulin concentrations measured by two oral glucose tolerance tests: the Hoorn Study. Diabetologia. 1996;39(3):298–305.