
Same Lunch, Different Order. How Much Can the Glucose Curve Change?
Keep the portions the same and change which food comes first. Two crossover trials compare the post-meal peak, area under the curve, and time in range.
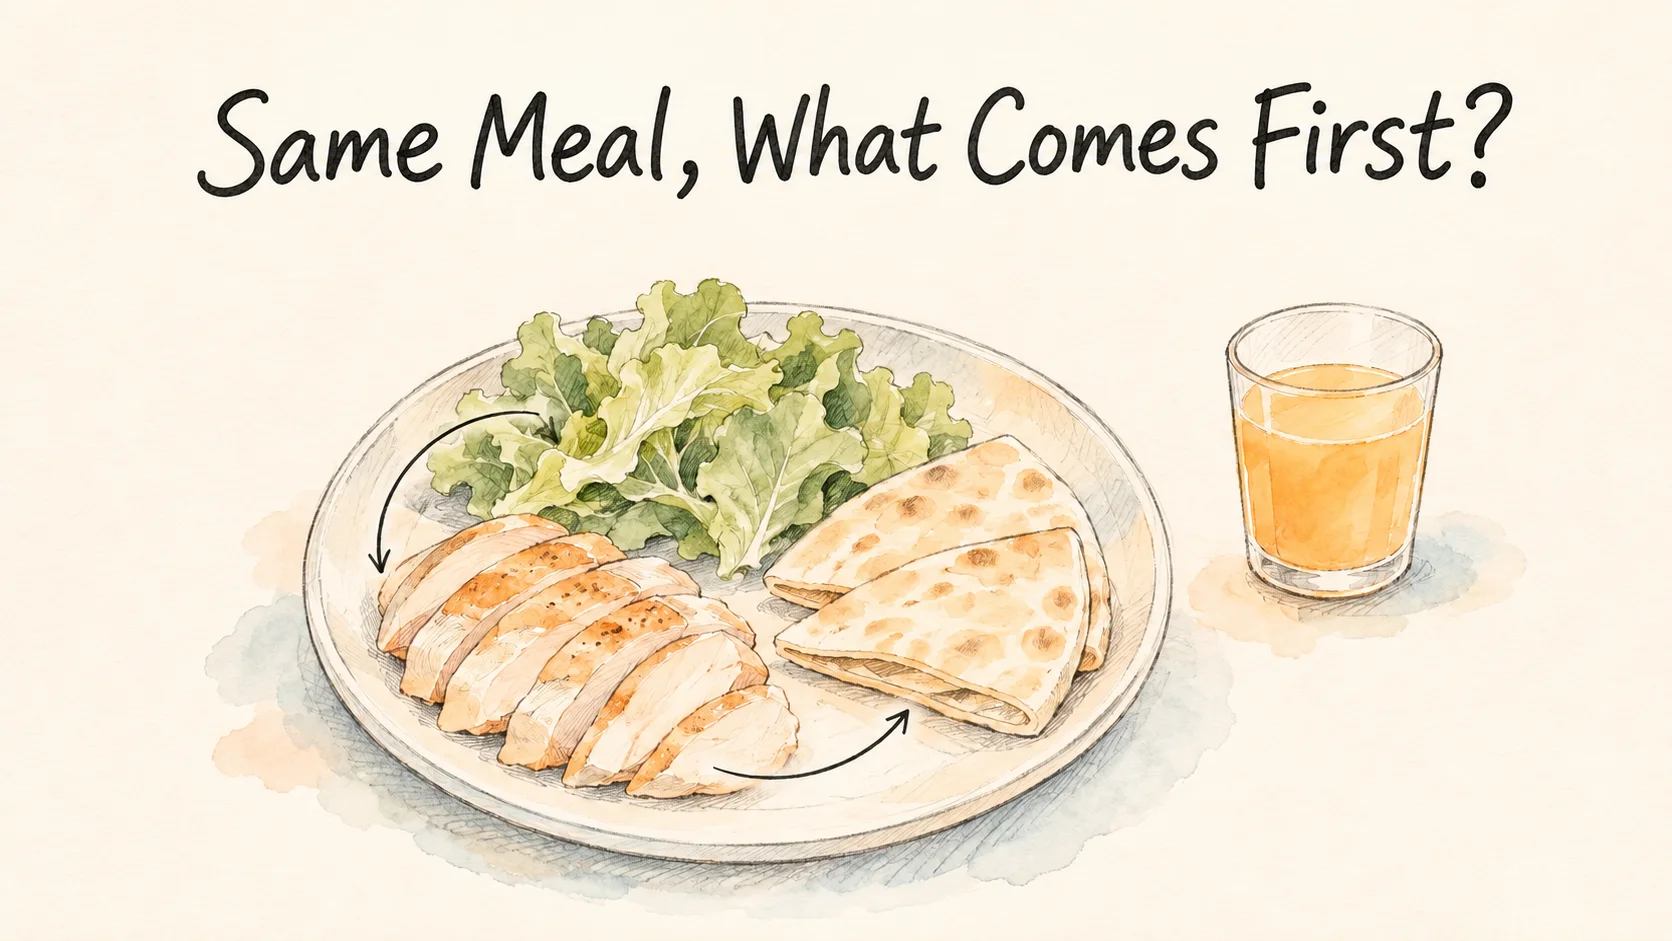
Lunch is bread, chicken breast, salad, and a glass of orange juice. You can tear off a piece of bread first or pick up your fork and start with the salad. Either way, you're eating the same amount. In a Weill Cornell study of adults with type 2 diabetes taking metformin, saving the bread and juice for last brought the measured rise at the glucose peak down from about 75 to 35 mg/dL [1].
That number is the height measured from before the meal. To see what happens when people follow the same order for several days, you can also measure how long glucose readings stay inside a defined range and how high the readings average. A later study found different results for those two measures [2].
The peak and the area tell you different things
The starch in bread breaks down into glucose, which can then be absorbed in the small intestine. Eating the bread and drinking the juice first brings those carbohydrates into the digestive tract earlier. Start with the chicken and salad, and the bread and juice arrive later. The amount of carbohydrate in the whole lunch is the same. The order changes what the digestive system encounters and when. Repeated samples show how quickly and how far glucose readings actually climb [1].
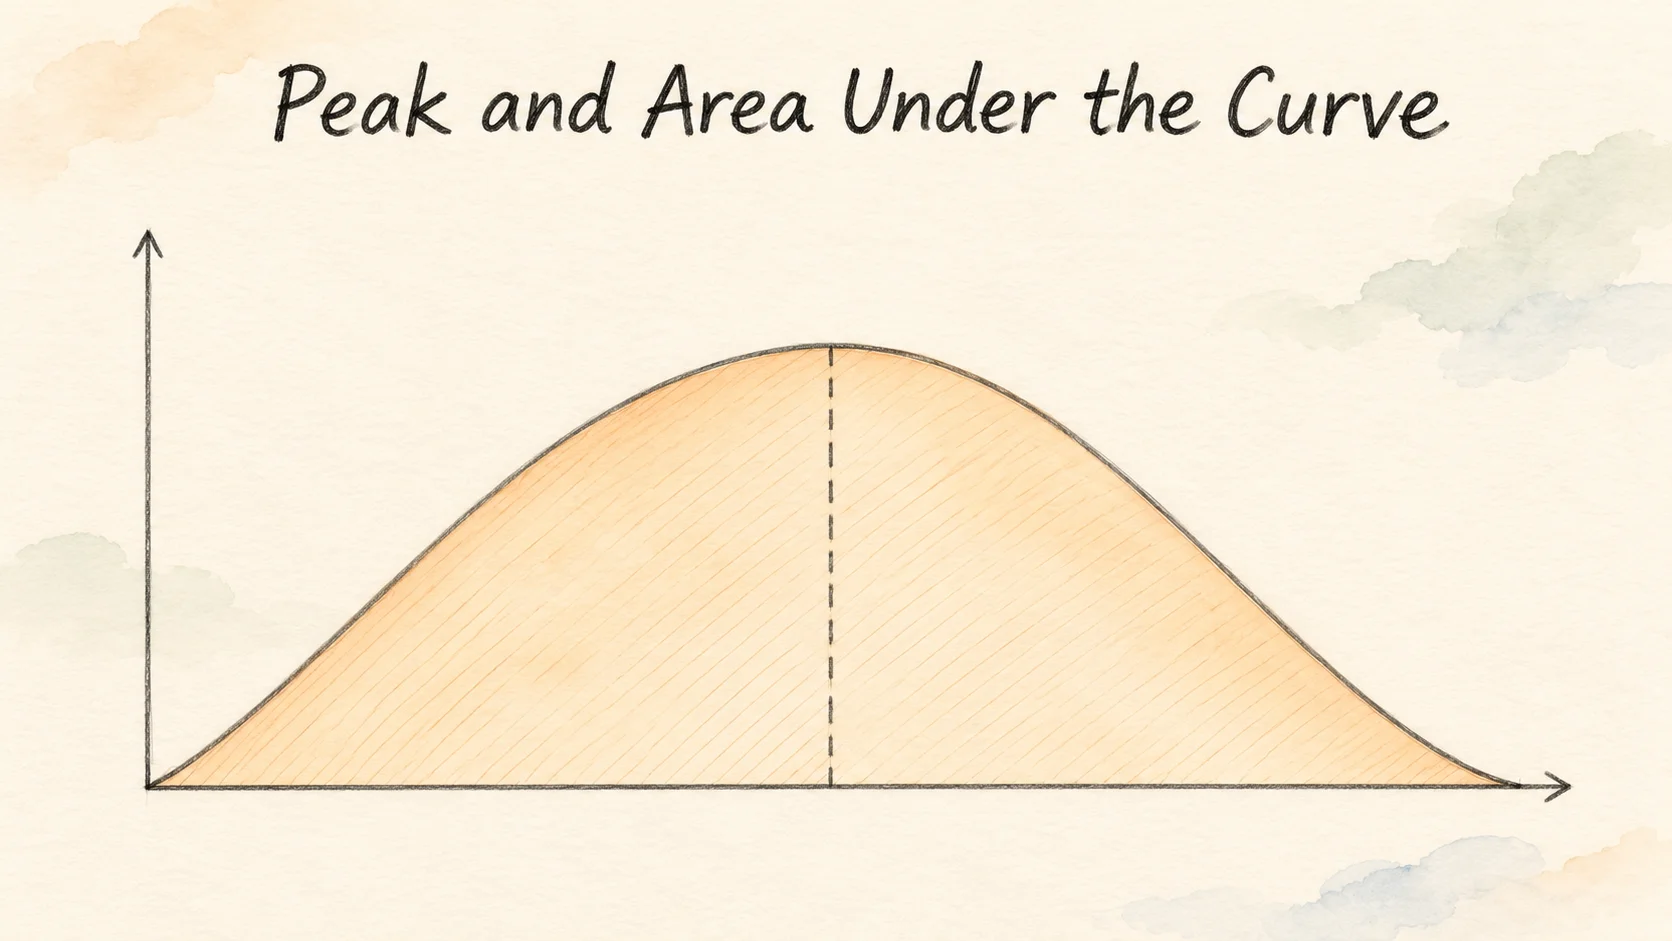
Say the reading before lunch is 120 mg/dL and the highest measured after lunch is 155 mg/dL. The rise is 155 − 120 = 35 mg/dL. That's an example to show the arithmetic. A second meal could reach the same peak and stay near it longer. Its area under the curve above the starting level would be larger. The peak tells you how high the readings went. The area also accounts for how long they stayed elevated.
Check when the clock starts, too. Both meal orders use the beginning of lunch as time zero. If the bread and juice come last, they reach the person later on that shared clock. Thirty minutes from the first bite is one comparison. Thirty minutes from the first bite of bread would be a different one.
The same people ate the same food in three orders
In 2017, the researchers recruited 16 adults with type 2 diabetes who were about 58 years old on average and taking a stable dose of metformin. Each ate the same test meal on three days, and the study assigned the order of those visits at random. The researchers drew blood immediately before the meal and every 30 minutes for up to three hours from the start of eating [1].
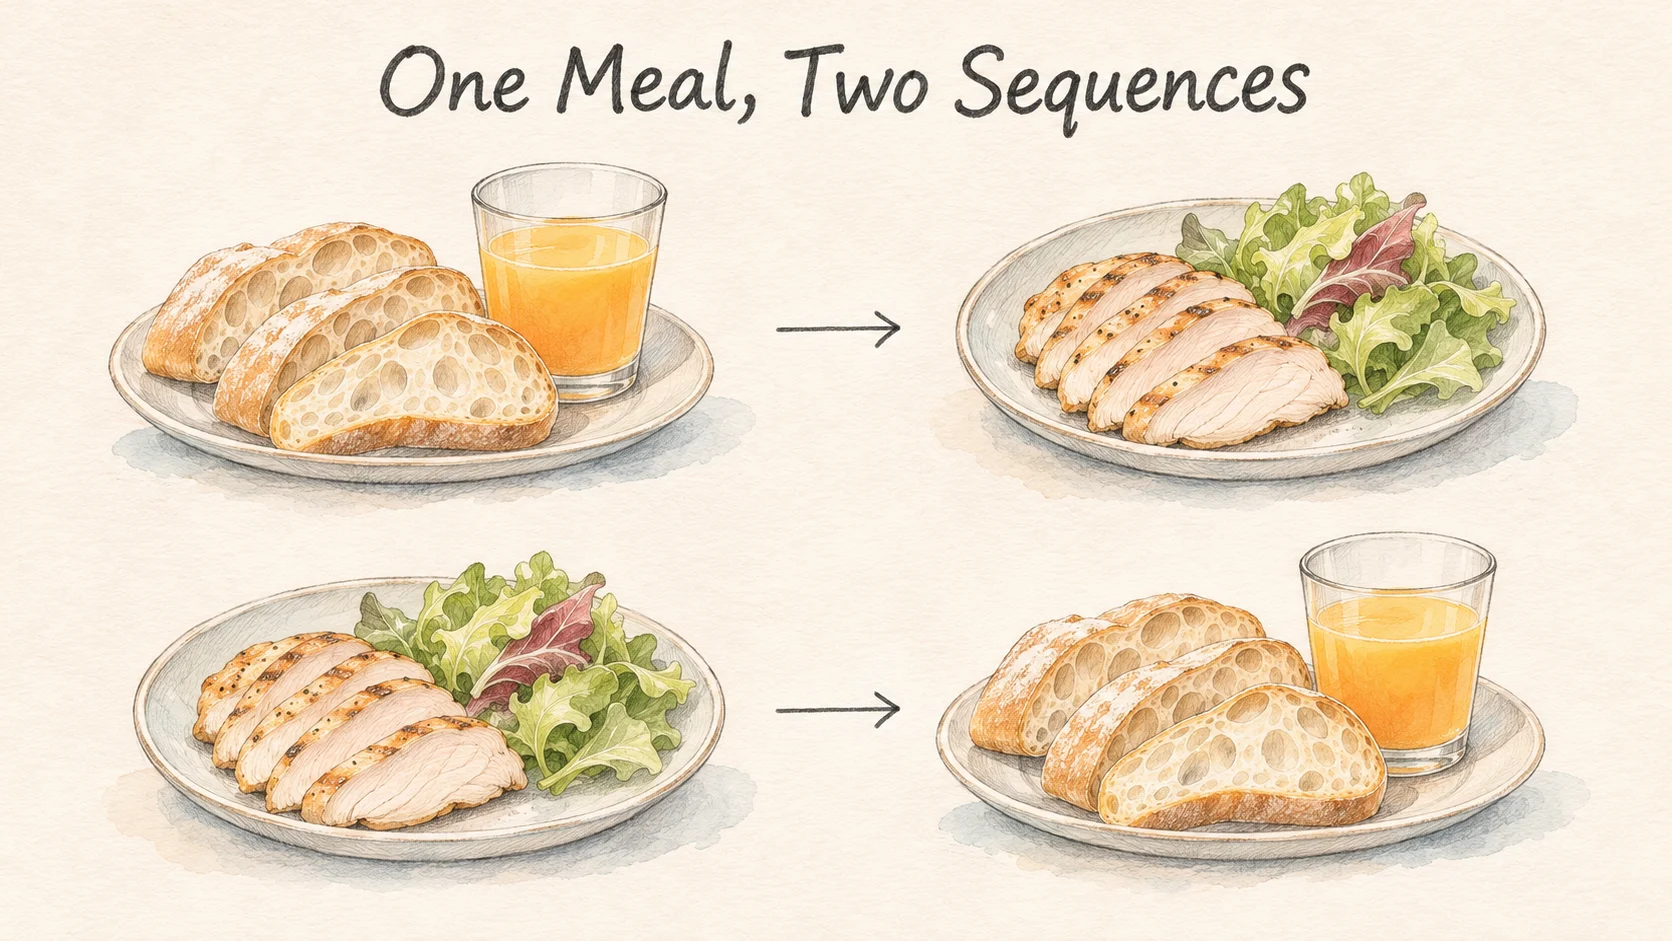
On one visit, the participants ate the bread and drank the juice first, followed by the chicken and salad. On another, they reversed that order. For each of those visits, the two parts of the meal took ten minutes each, with a ten-minute rest in between. On the third visit, the same ingredients were served together as a sandwich with juice and eaten in two portions. The illustration shows the first two orders [1].
| Order of the foods in the trial | Average rise at the measured peak |
|---|---|
| Bread and juice first | 75.0 mg/dL |
| Foods eaten together | 58.2 mg/dL |
| Bread and juice last | 34.7 mg/dL |
The three-hour area above baseline was about 53% smaller when the bread and juice came last than when they came first. Use the sandwich version as the comparison and the difference is about 44%. A headline that says “about half” needs a denominator. Read it alongside the meal order it is comparing and the part of the curve it is describing [1].
There is another detail in the published curves. The bread-and-juice-last meal produced a smaller early rise. At the three-hour draw, however, the group’s mean glucose was higher than on the bread-and-juice-first day. The curves moved past each other. A lower peak tells us about the peak, and a reading at the end of lunch follow-up tells us about that one moment [1].
Having everyone try all three meals makes each person their own comparison. It reduces the effect of differences between people. The researchers also set the ingredients, timing, and pause between parts of the meal. The table describes the result for this meal, in this group, under those conditions.
What happened during the days people were home?
The same team later enrolled 20 adults with type 2 diabetes taking metformin. Everyone spent six days eating carbohydrates last and six days eating them first. The research kitchen provided the meals. The first five days of each period were spent in everyday life, with a continuous glucose monitor and a food log. On day six, participants ate a breakfast in the lab with no pause between courses, and the team drew blood over three hours [2].
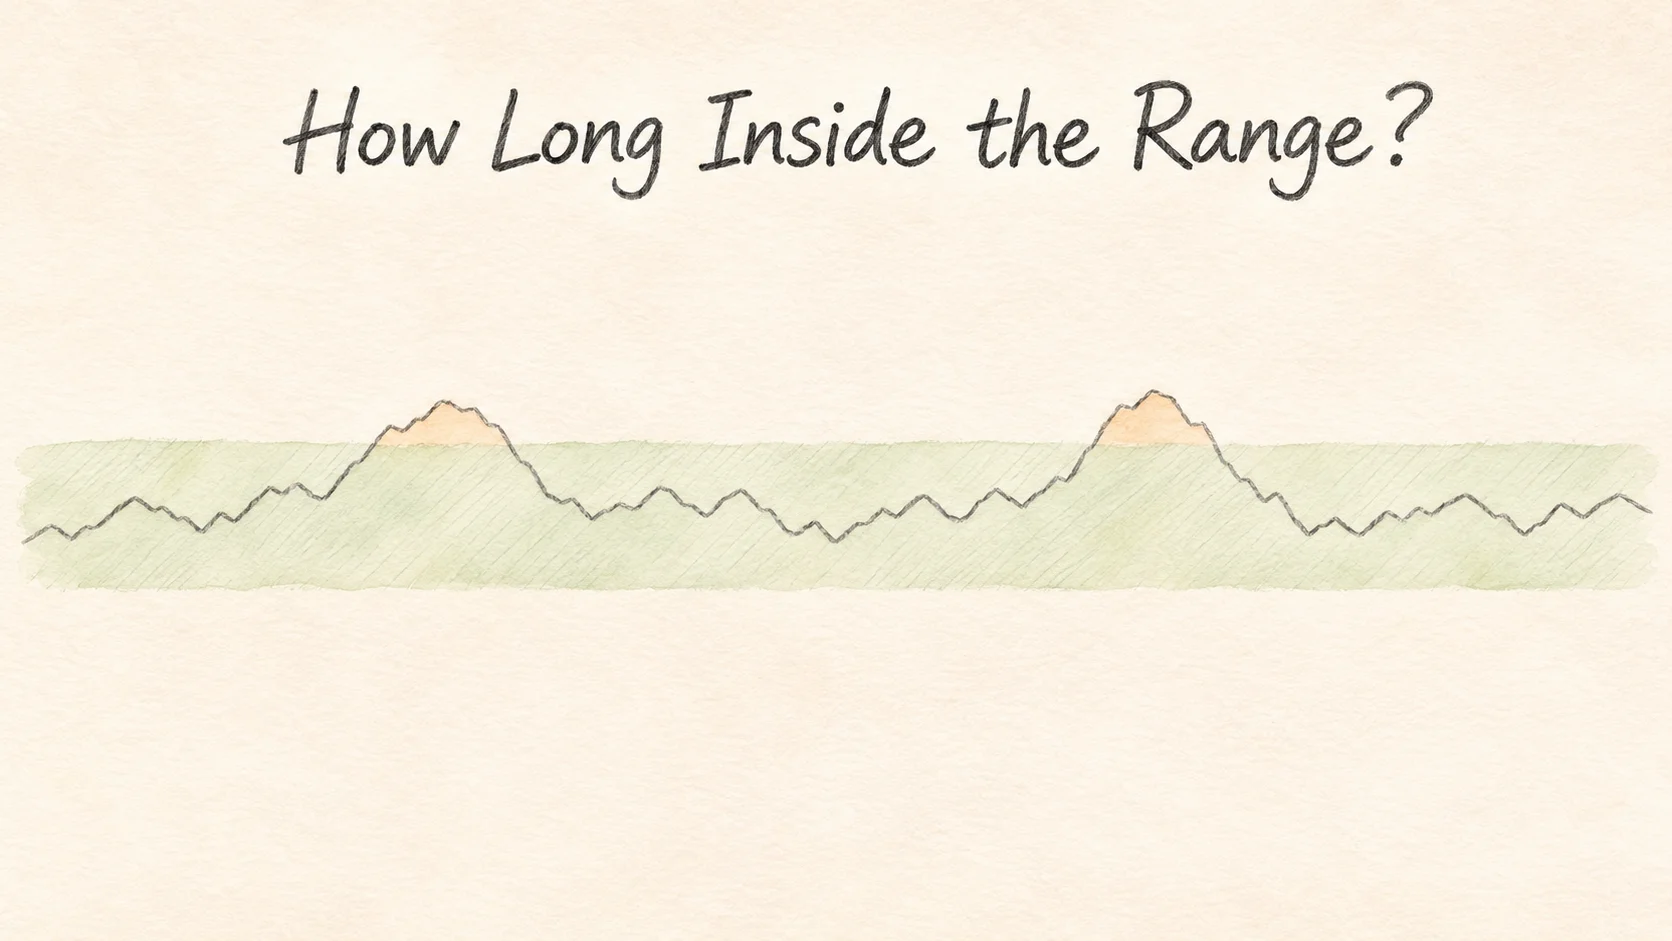
During the days at home, an average of 84.8% of time was in the study's glucose range when carbohydrates came last, compared with 78.6% when they came first. The difference is 6.2 percentage points. Multiply 0.062 by 1,440 minutes in a day and you get about 89 minutes. That's an illustration using the study averages. Average glucose was 146.0 mg/dL when carbohydrates came last and 152.3 mg/dL when they came first, a difference that wasn't statistically significant [2].
Think of the target range as the shaded band in the drawing. Time in range counts how much of the record stays in that band. Average glucose takes all the low and high values together. The blood samples from the separate breakfast test without a pause also showed a smaller rise at the peak when carbohydrates came last. That result comes from a breakfast in the lab. The time-in-range result comes from the monitor during the days out of the lab [2].
Nineteen people had glucose data from that lab breakfast, compared with twenty for the days at home. The average rise at the breakfast peak was 48.3 mg/dL for carbohydrates last and 85.7 mg/dL for carbohydrates first. The breakfast result shows the difference with no scheduled pause under those conditions. The home readings show what happened to time in range over longer stretches [2].
Imagine two pairs of readings. One has 100 and 160 mg/dL, and the other has 80 and 180 mg/dL. Both average 130 mg/dL. In a purely illustrative band of 90 to 170, both points in the first pair are inside and both in the second pair are outside. A real monitor provides many more points, but the difference between the questions is the same. This example is just arithmetic [2].
What to look for in a claim about meal order
When you read that something cut glucose “in half,” look for the two meal orders being compared. Then check what was halved and how long researchers measured it. In one study here, the clock ran for three hours after lunch. In the other, the researchers followed glucose across days. Both groups were taking metformin. The studies were too short to show whether meal order changes HbA1c, a measure that reflects glucose over months [1, 2].
If you're already receiving care for your glucose, bring an example meal and the measurement you want to understand to your care team. At the lunch table, the bread and juice were still there. Moving them changed when the participants ate them, and several different measurements showed what happened afterward.
References
[1] Shukla AP, et al. Carbohydrate-last meal pattern lowers postprandial glucose and insulin excursions in type 2 diabetes. BMJ Open Diabetes Res Care. 2017;5(1):e000440.
[2] Touhamy S II, et al. Carbohydrates-last food order improves time in range and reduces glycemic variability. Diabetes Care. 2025;48(2):e15–e16.